wget https://github.com/prometheus/prometheus/releases/download/v3.5.0/prometheus-3.5.0.linux-amd64.tar.gz
[root@prometheus-server31 ~]# tar xf prometheus-3.5.0.linux-amd64.tar.gz -C /usr/local/
[root@prometheus-server31 /usr/local]# cd prometheus-3.5.0.linux-amd64/
[root@prometheus-server31 /usr/local/prometheus-3.5.0.linux-amd64]# ./prometheus
http://10.0.0.31:9090/targets
rm -rf /usr/local/prometheus-3.5.0.linux-amd64/
rm -f prometheus-3.5.0.linux-amd64.tar.gz
#!/bin/bash

VERSION=2.53.4
ARCH=amd64
SOFTWARE=prometheus-${VERSION}.linux-${ARCH}.tar.gz
URL=https://github.com/prometheus/prometheus/releases/download/v${VERSION}/${SOFTWARE}
DOWNLOAD=./download
INSTALLDIR=/app/tools
BASEDIR=${INSTALLDIR}/prometheus-${VERSION}.linux-amd64
DATADIR=/app/tools/data/prometheus
LOGDIR=/app/tools/logs/prometheus
HOSTIP=0.0.0.0
PORT=9090
HOSTNAME=`hostname`

function prepare() {
  # 判断目录是否存在,若不存在则创建
  [ -d $INSTALLDIR ] || install -d  ${INSTALLDIR}
  [ -d $DOWNLOAD ] || install -d ${DOWNLOAD}
  [ -d $DATADIR ] || install -d ${DATADIR}
  [ -d $LOGDIR ] || install -d ${LOGDIR}

  . /etc/os-release

  if [ "$ID" == "centos" ];then
    # 判断系统是否安装wget
    [ -f /usr/bin/wget ] || yum -y install wget
  fi

  # 判断文件是否存在,若不存在则下载
  [ -s ${DOWNLOAD}/${SOFTWARE} ] || wget $URL -O ${DOWNLOAD}/${SOFTWARE}

}

function deploy() {
  # 检查环境
  prepare

  # 解压文件软件包
  tar xf ${DOWNLOAD}/${SOFTWARE} -C ${INSTALLDIR}

  # 生成启动脚本
cat > /etc/systemd/system/prometheus-server.service <<EOF
[Unit]
Description=Prometheus Server
Documentation=https://prometheus.io/docs/introduction/overview/
After=network.target

[Service]
Restart=on-failure
ExecStart=/bin/bash -c "${BASEDIR}/prometheus \
   --config.file=${BASEDIR}/prometheus.yml \
	 --web.enable-lifecycle \
	 --storage.tsdb.path=${DATADIR} \
	 --storage.tsdb.retention.time=60d  \
	 --web.listen-address=${HOSTIP}:${PORT}  \
	 --web.max-connections=65535  \
	 --storage.tsdb.retention.size=512MB \
	 --query.timeout=10s \
	 --query.max-concurrency=20 \
	 --log.level=info \
	 --log.format=json \
	 --web.read-timeout=5m &>> ${LOGDIR}/prometheus-server.log"
ExecReload=/bin/kill -HUP \$MAINPID
LimitNOFILE=65535

[Install]
WantedBy=multi-user.target
EOF

  # 将服务设置为开机自启动
  systemctl daemon-reload
  systemctl enable --now prometheus-server
  systemctl status prometheus-server
  sleep 0.3
  ss -ntl | grep ${PORT}
}

function delete(){
  systemctl disable --now prometheus-server.service
  rm -rf /etc/systemd/system/node-exporter.service $BASEDIR $DATADIR $LOGDIR
}

function main() {
  case $1 in
    deploy|i)
      deploy
      echo "${HOSTNAME} 的prometheus-server 已经部署成功![successfully]"
      ;;
    delete|r)
      delete
      echo "${HOSTNAME} 的prometheus-server 已经卸载成功~"
      ;;
    *)
      echo "Usage: $0 deploy[i]|delete[r]"
      ;;
  esac
}

main $1
wget https://github.com/prometheus/node_exporter/releases/download/install-node-exporter-v1.9.1.tar.gz
[root@node-exporter41 ~]# tar xf install-node-exporter-v1.9.1.tar.gz
#!/bin/bash

VERSION=1.9.1
SOFTWARE=node_exporter-${VERSION}.linux-amd64.tar.gz
URL=https://github.com/prometheus/node_exporter/releases/download/v${VERSION}/${SOFTWARE}
DOWNLOAD=./download
INSTALLDIR=/app/tools/
BASEDIR=${INSTALLDIR}/node_exporter-${VERSION}.linux-amd64
HOST="0.0.0.0"
PORT=9100
hostname=`hostname`

function prepare() {
   # 判断目录是否存在,若不存在则创建
   [ -d $INSTALLDIR ] || mkdir -pv ${INSTALLDIR}
   [ -d $DOWNLOAD ] || mkdir -pv ${DOWNLOAD}

   if [ "$ID" == "centos" ];then
     # 判断系统是否安装curl
     [ -f /usr/bin/wget ] || yum -y install wget
   fi

   # 判断文件是否存在,若不存在则下载
   [ -s ${DOWNLOAD}/${SOFTWARE} ] || wget $URL -O ${DOWNLOAD}/${SOFTWARE}
}

function install() {
  # 检查环境
  prepare

  # 解压文件软件包
  tar xf ${DOWNLOAD}/${SOFTWARE} -C ${INSTALLDIR}

  # 生成启动脚本
  cat > /etc/systemd/system/node-exporter.service <<EOF
[Unit]
Description=Linux Node Exporter
Documentation=https://prometheus.io/docs/introduction/overview/
After=network.target

[Service]
ExecStart=${BASEDIR}/node_exporter --web.telemetry-path="/metrics" \
   --web.listen-address=${HOST}:${PORT}


[Install]
WantedBy=multi-user.target
EOF

     # 将服务设置为开机自启动
     systemctl daemon-reload
     systemctl enable --now node-exporter.service
     systemctl status node-exporter.service
     ss -ntl | grep 9100
}

function remove(){
  systemctl disable --now node-exporter.service
  rm -rf /etc/systemd/system/node-exporter.service $BASEDIR
}


function main() {
  case $1 in
    install|i)
      install
      echo "${hostname} 的node-exporter 已经部署成功![successfully]"
      ;;
    remove|r)
      remove
      echo "${hostname} 的node-exporter 已经卸载成功,期待下次使用~"
      ;;
    *)
      echo "Usage: $0 install[i]|remove[r]"
      ;;
  esac
}

main $1
[root@node-exporter41 ~]# ./install-node-exporter.sh i
http://10.0.0.41:9100/metrics
[root@prometheus-server31 ~]# vim /app/tools/prometheus-2.53.4.linux-amd64/prometheus.yml
# 全局配置
global:
# 配置抓取监控目标的数据的时间周期。
scrape_interval: 3s
...
# 定义抓取目标的相关配置
scrape_configs:
...
# 指定Job的名称,可以自定义,生产环境中最好和相关业务命名。
- job_name: "node-exporter"
# 监控目标的uri
metrics_path: '/metrics'
# 监控目标的协议
scheme: 'http'
# 静态配置,配置要监控的目标IP地址相关信息
static_configs:
# 配置监控目标的IP地址和端口号。
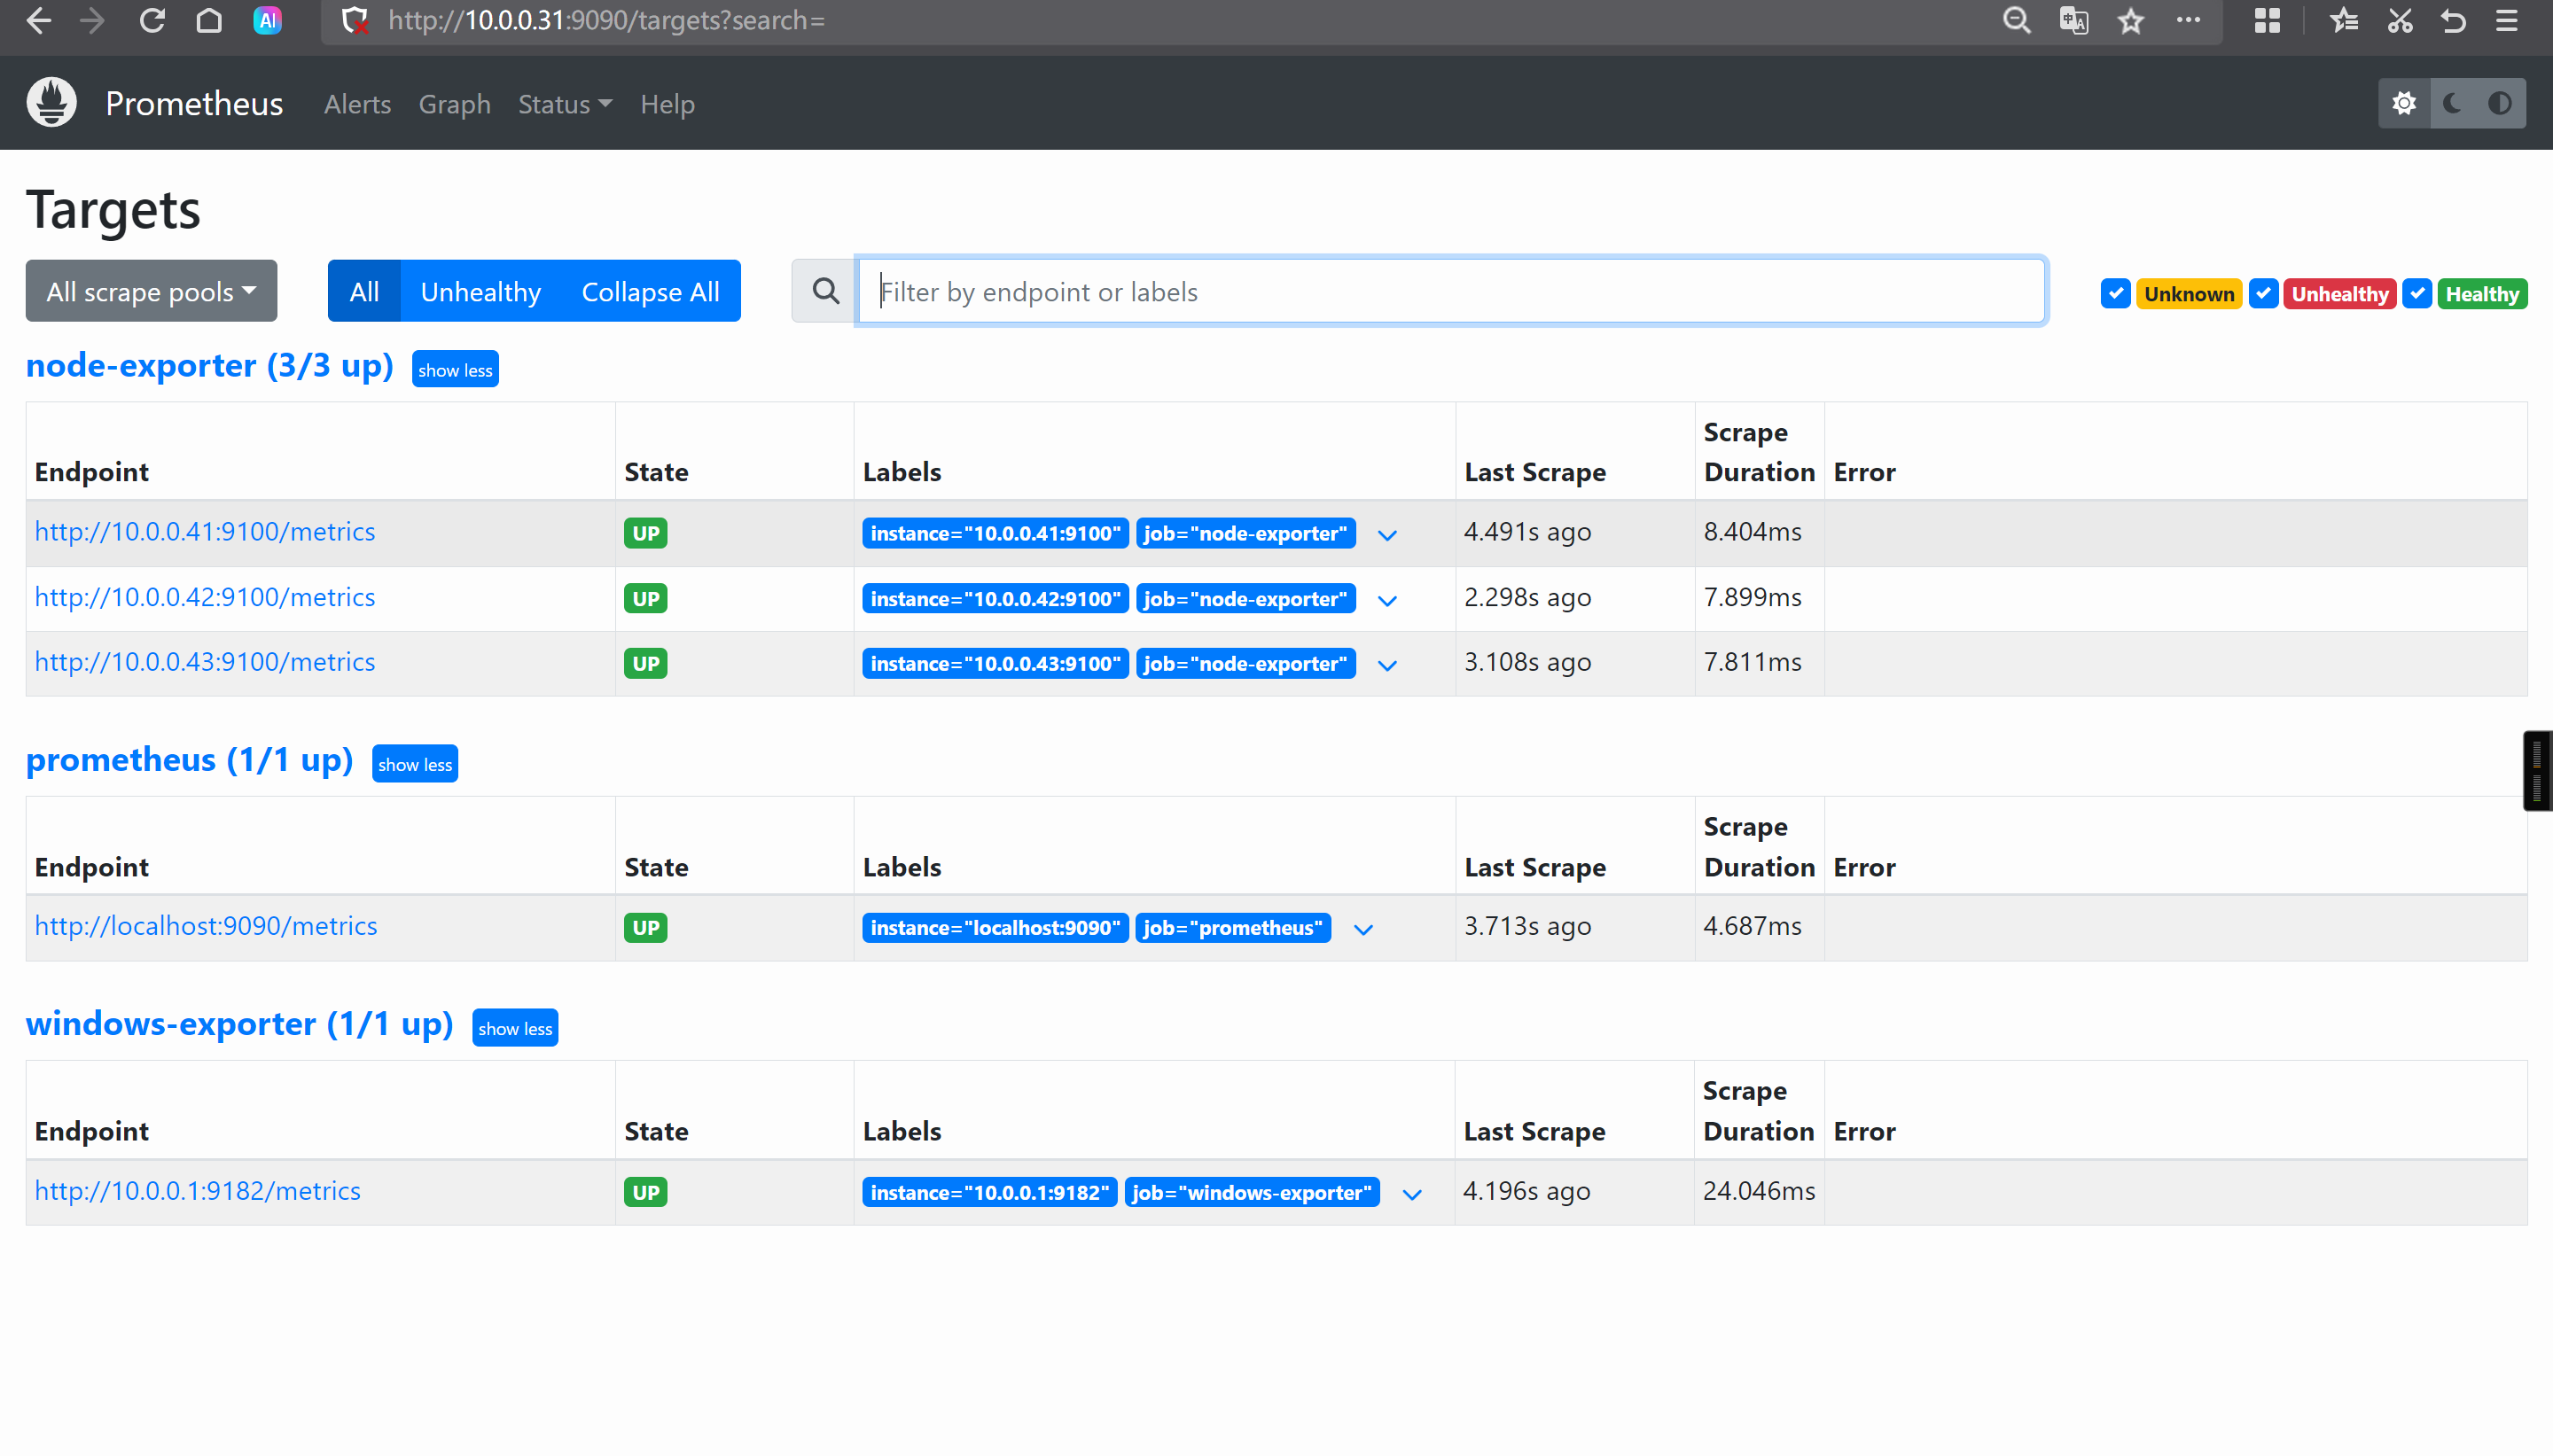
- targets: ["10.0.0.41:9100","10.0.0.42:9100","10.0.0.43:9100"]
[root@prometheus-server31 ~]# systemctl restart prometheus-server.service
gauge数据类型表示当前的值,是一种所见即所得的情况。
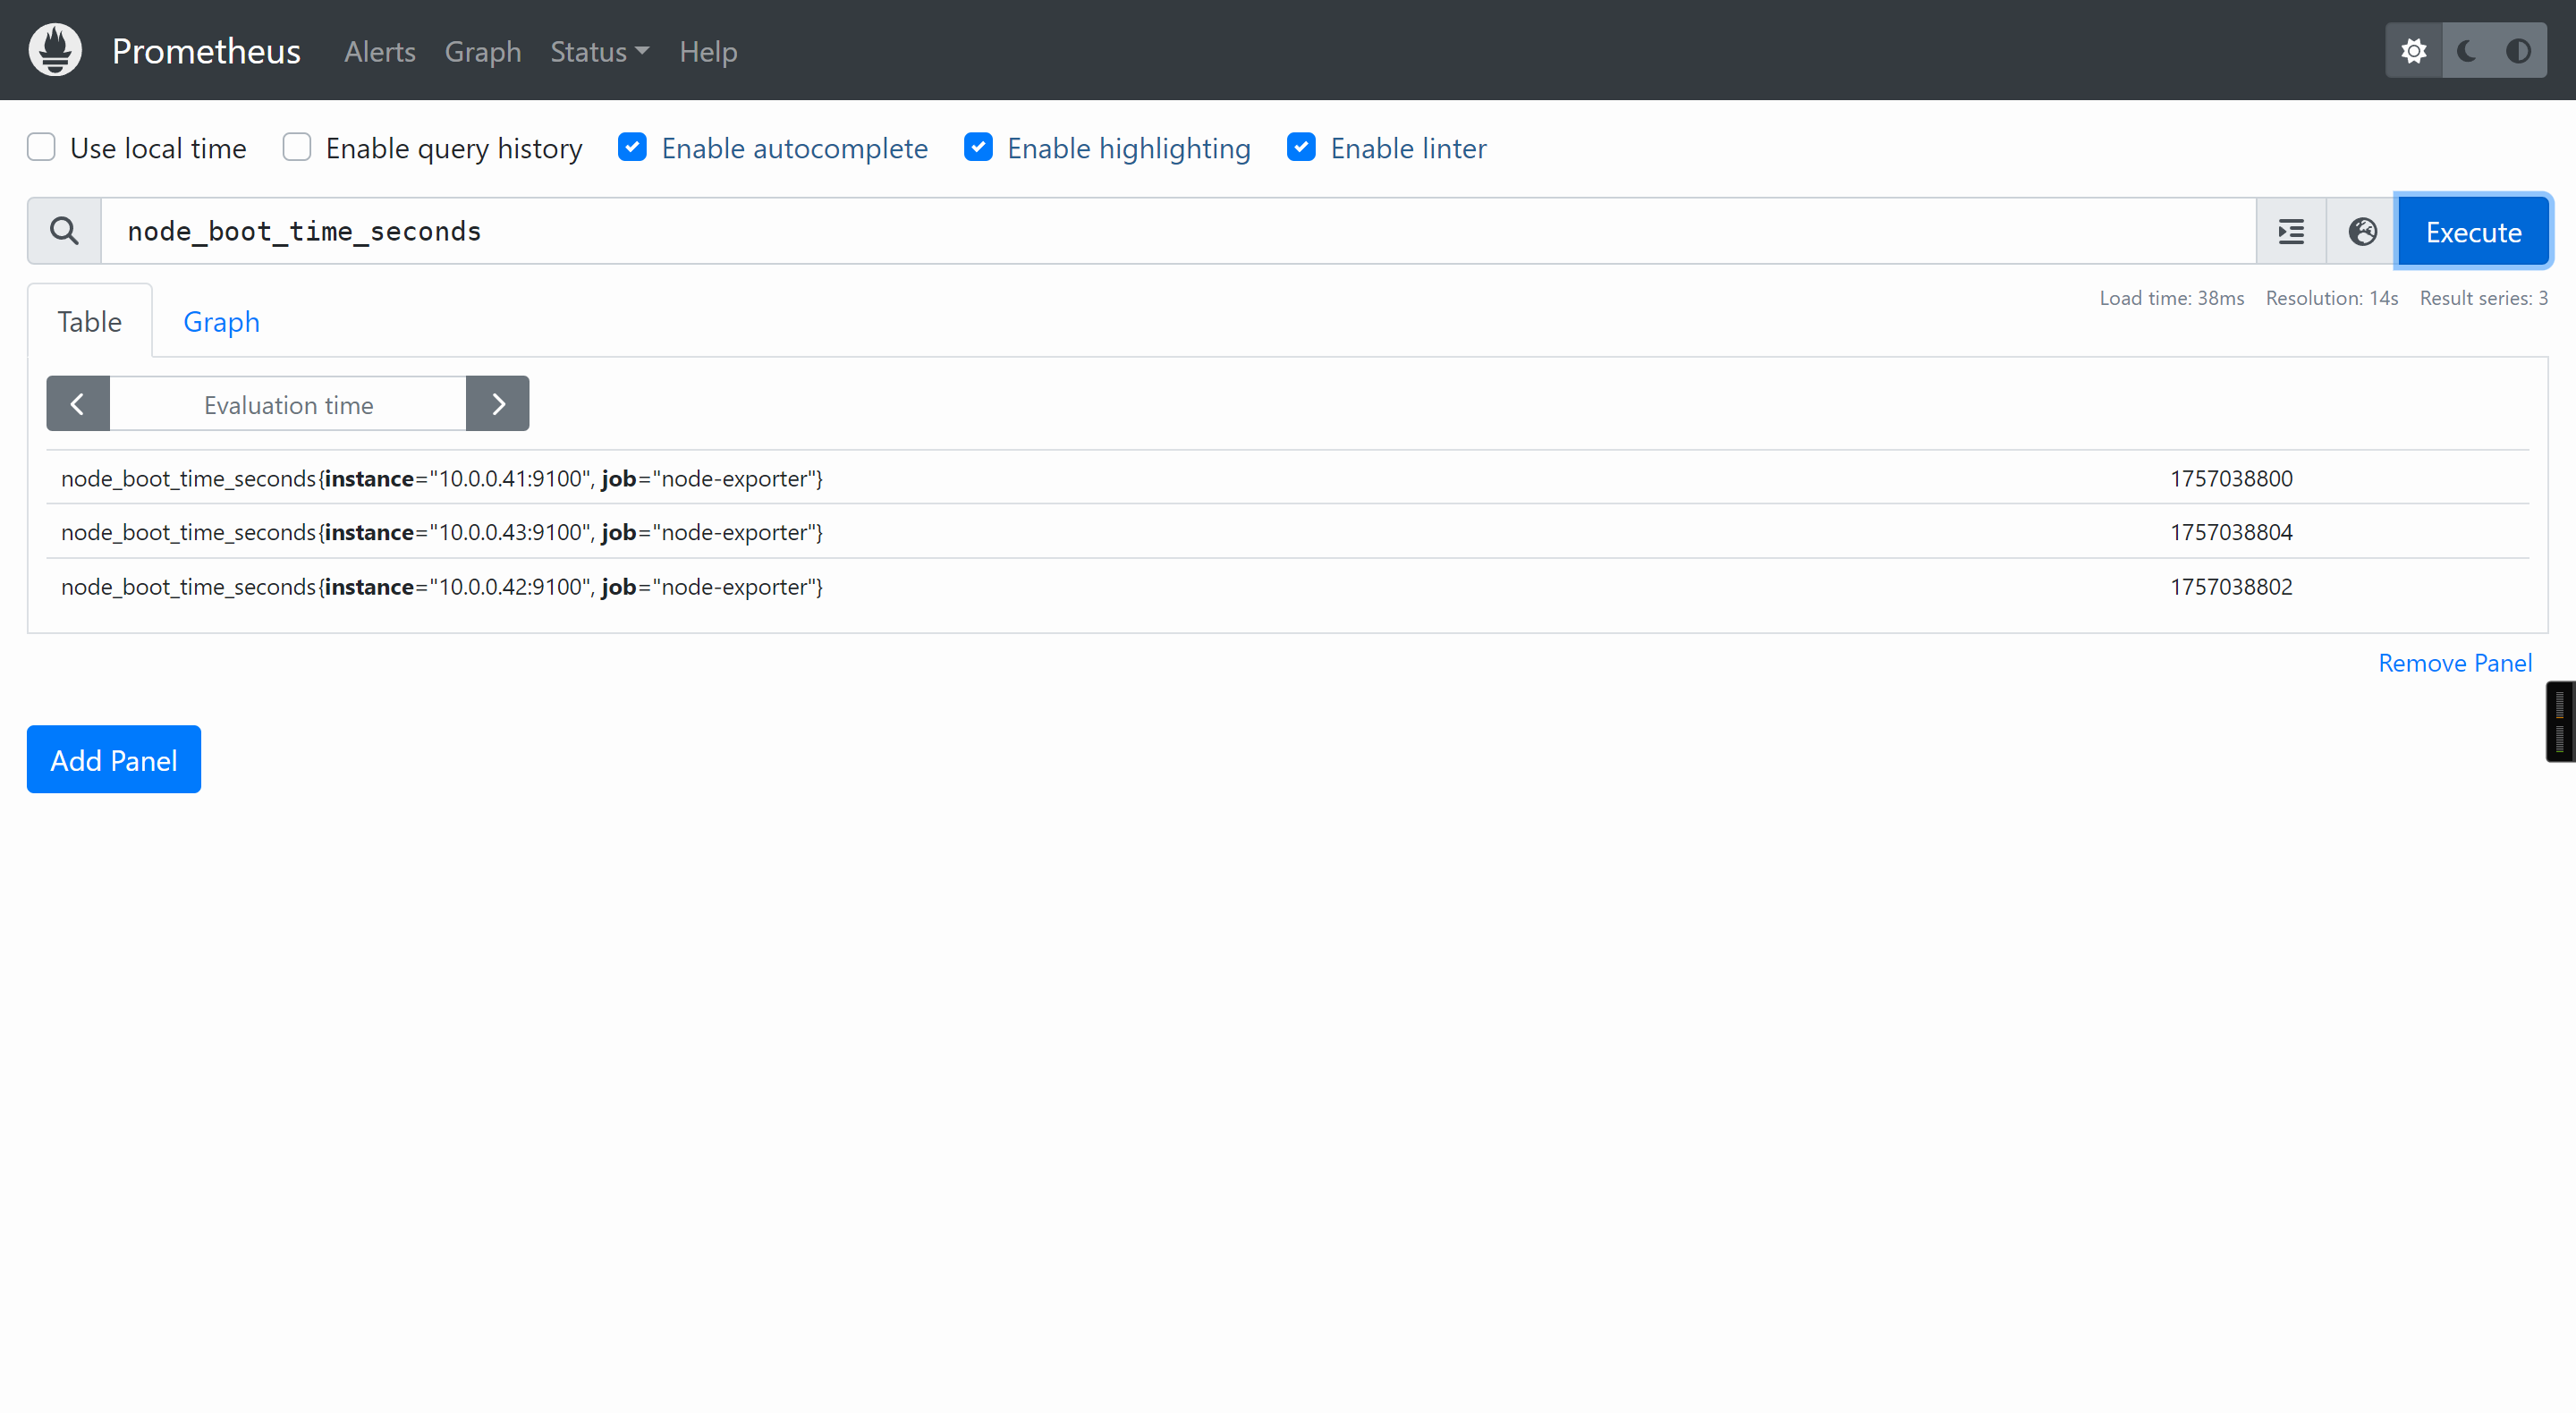
使用"node_boot_time_seconds"指标查看节点的启动时间,表示的是当前值。
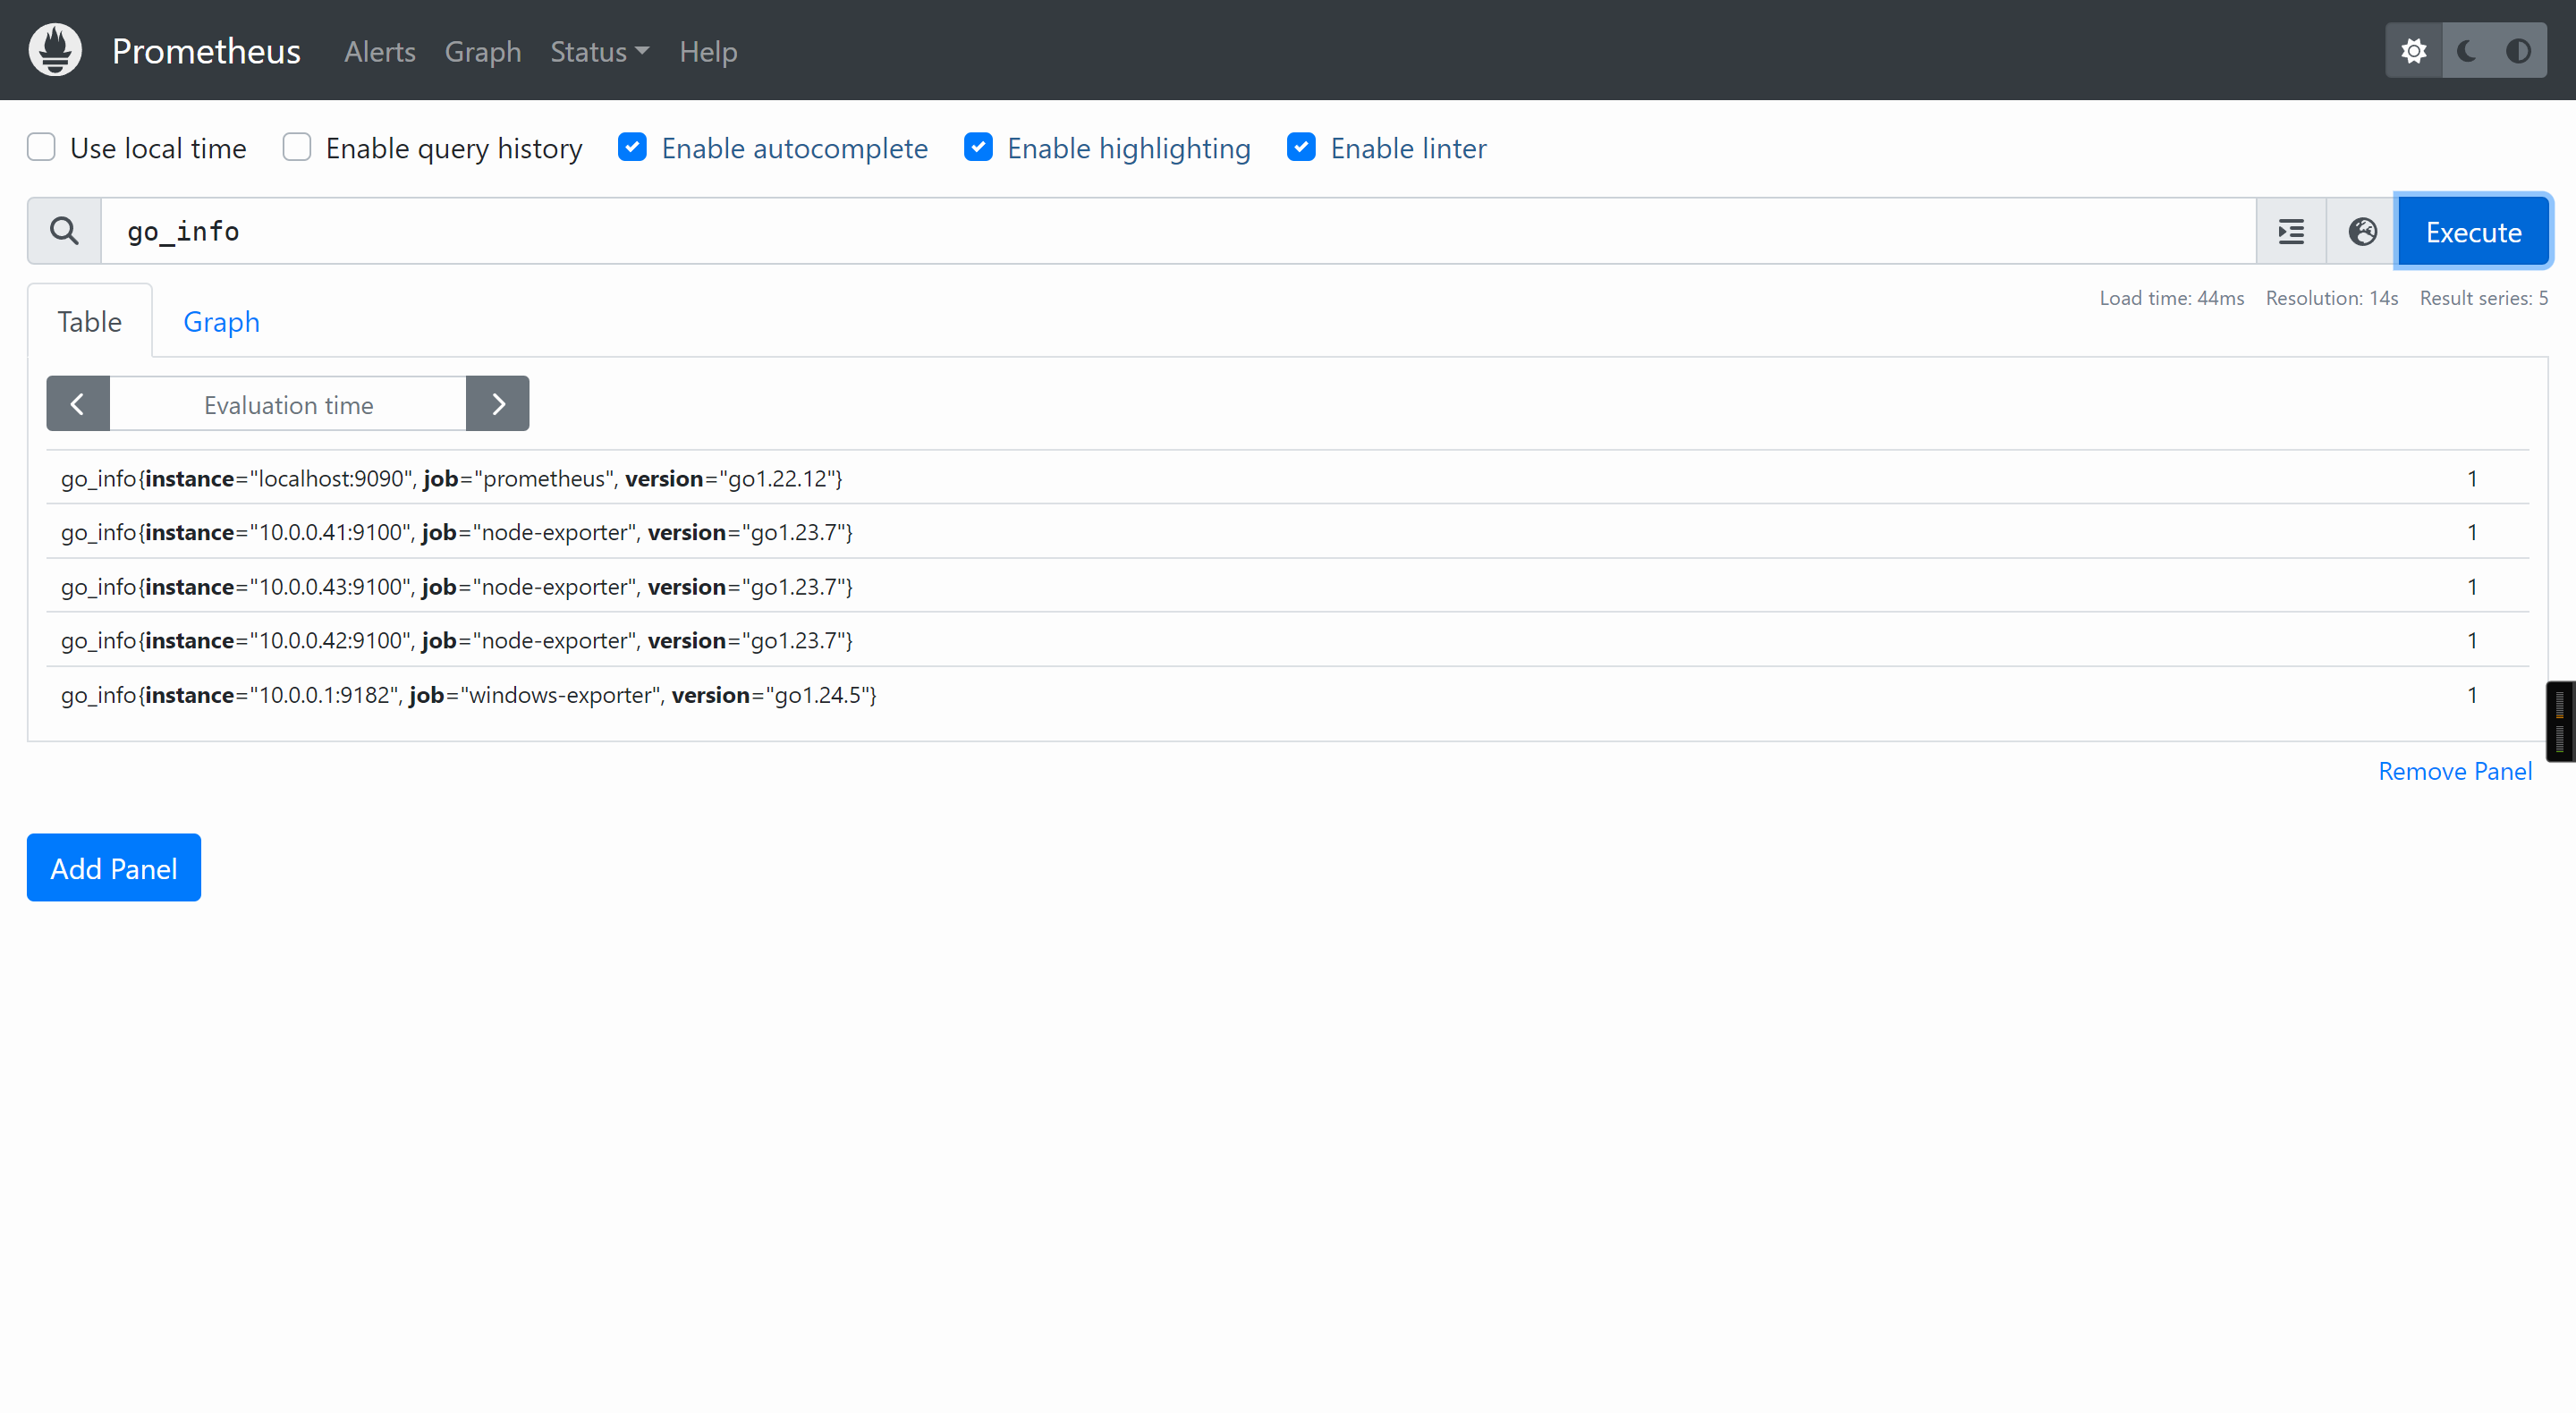
使用"go_info"指标查看go的版本信息,其返回值意义不大,这个时候标签的KEY和VALUE就能获取到我们想要的信息。
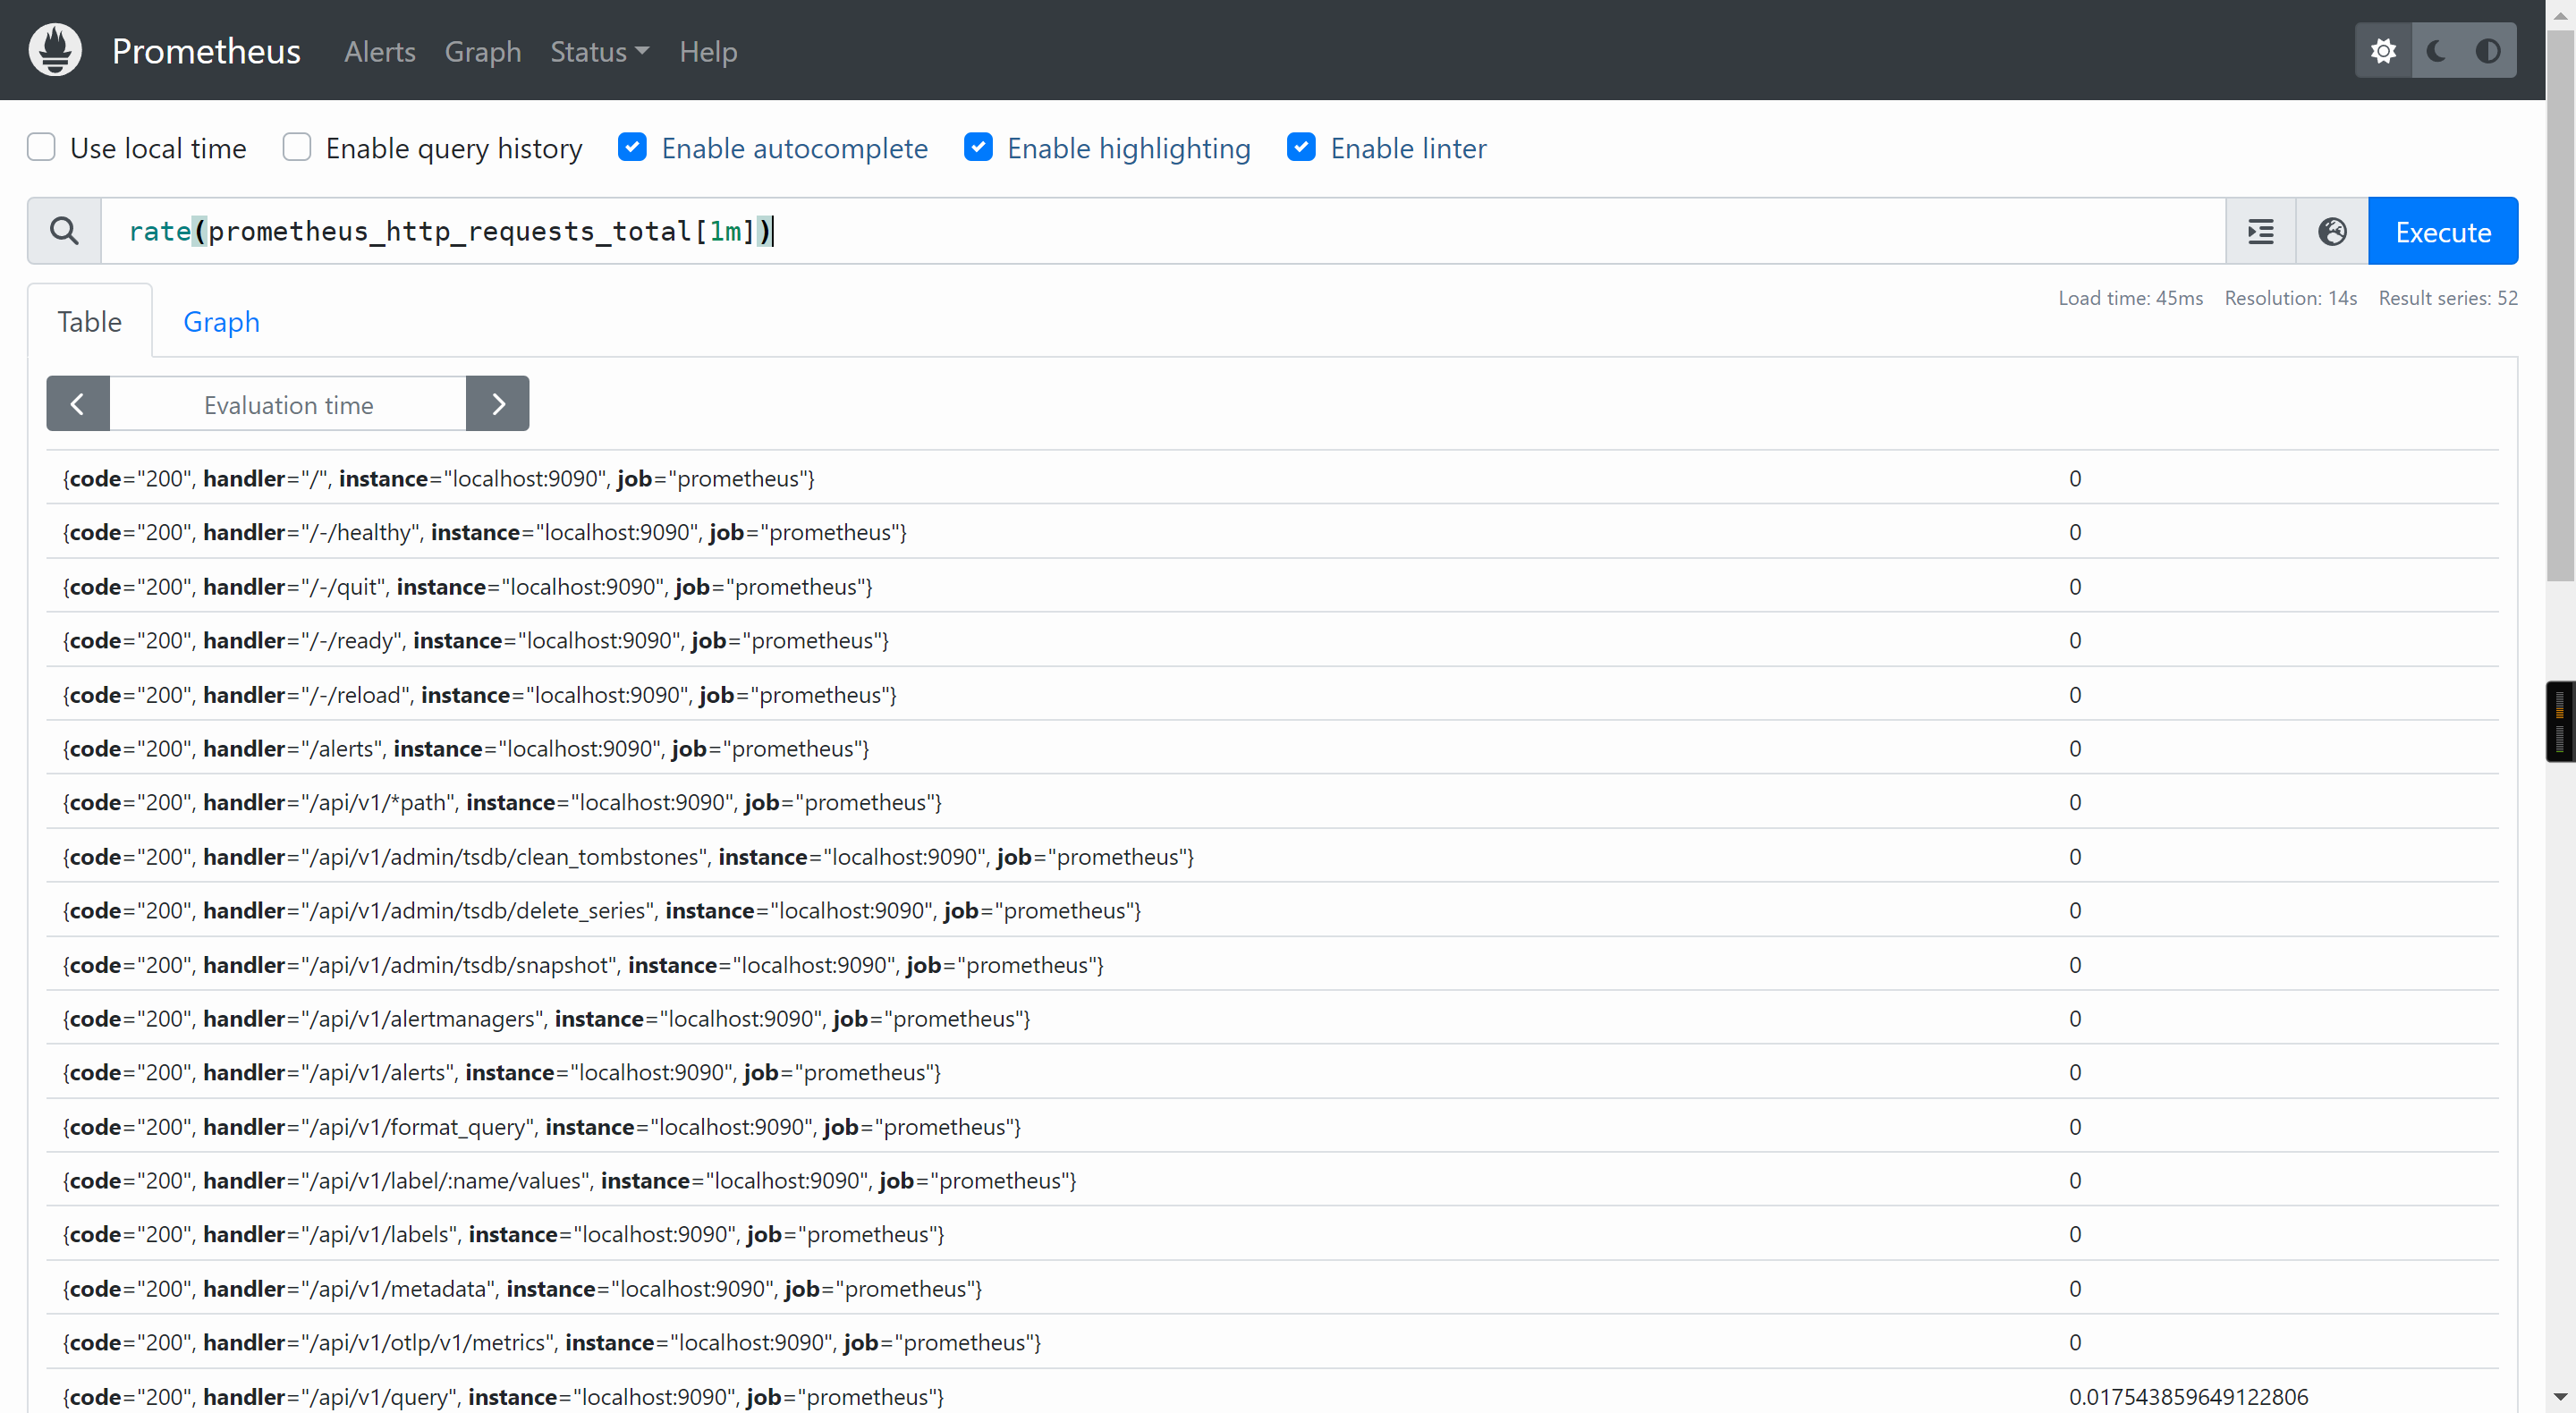
counter数据类型表示一个指标单调递增的计数器
一般可以结合rate查看QPS,比如: rate(prometheus_http_requests_total[1m])
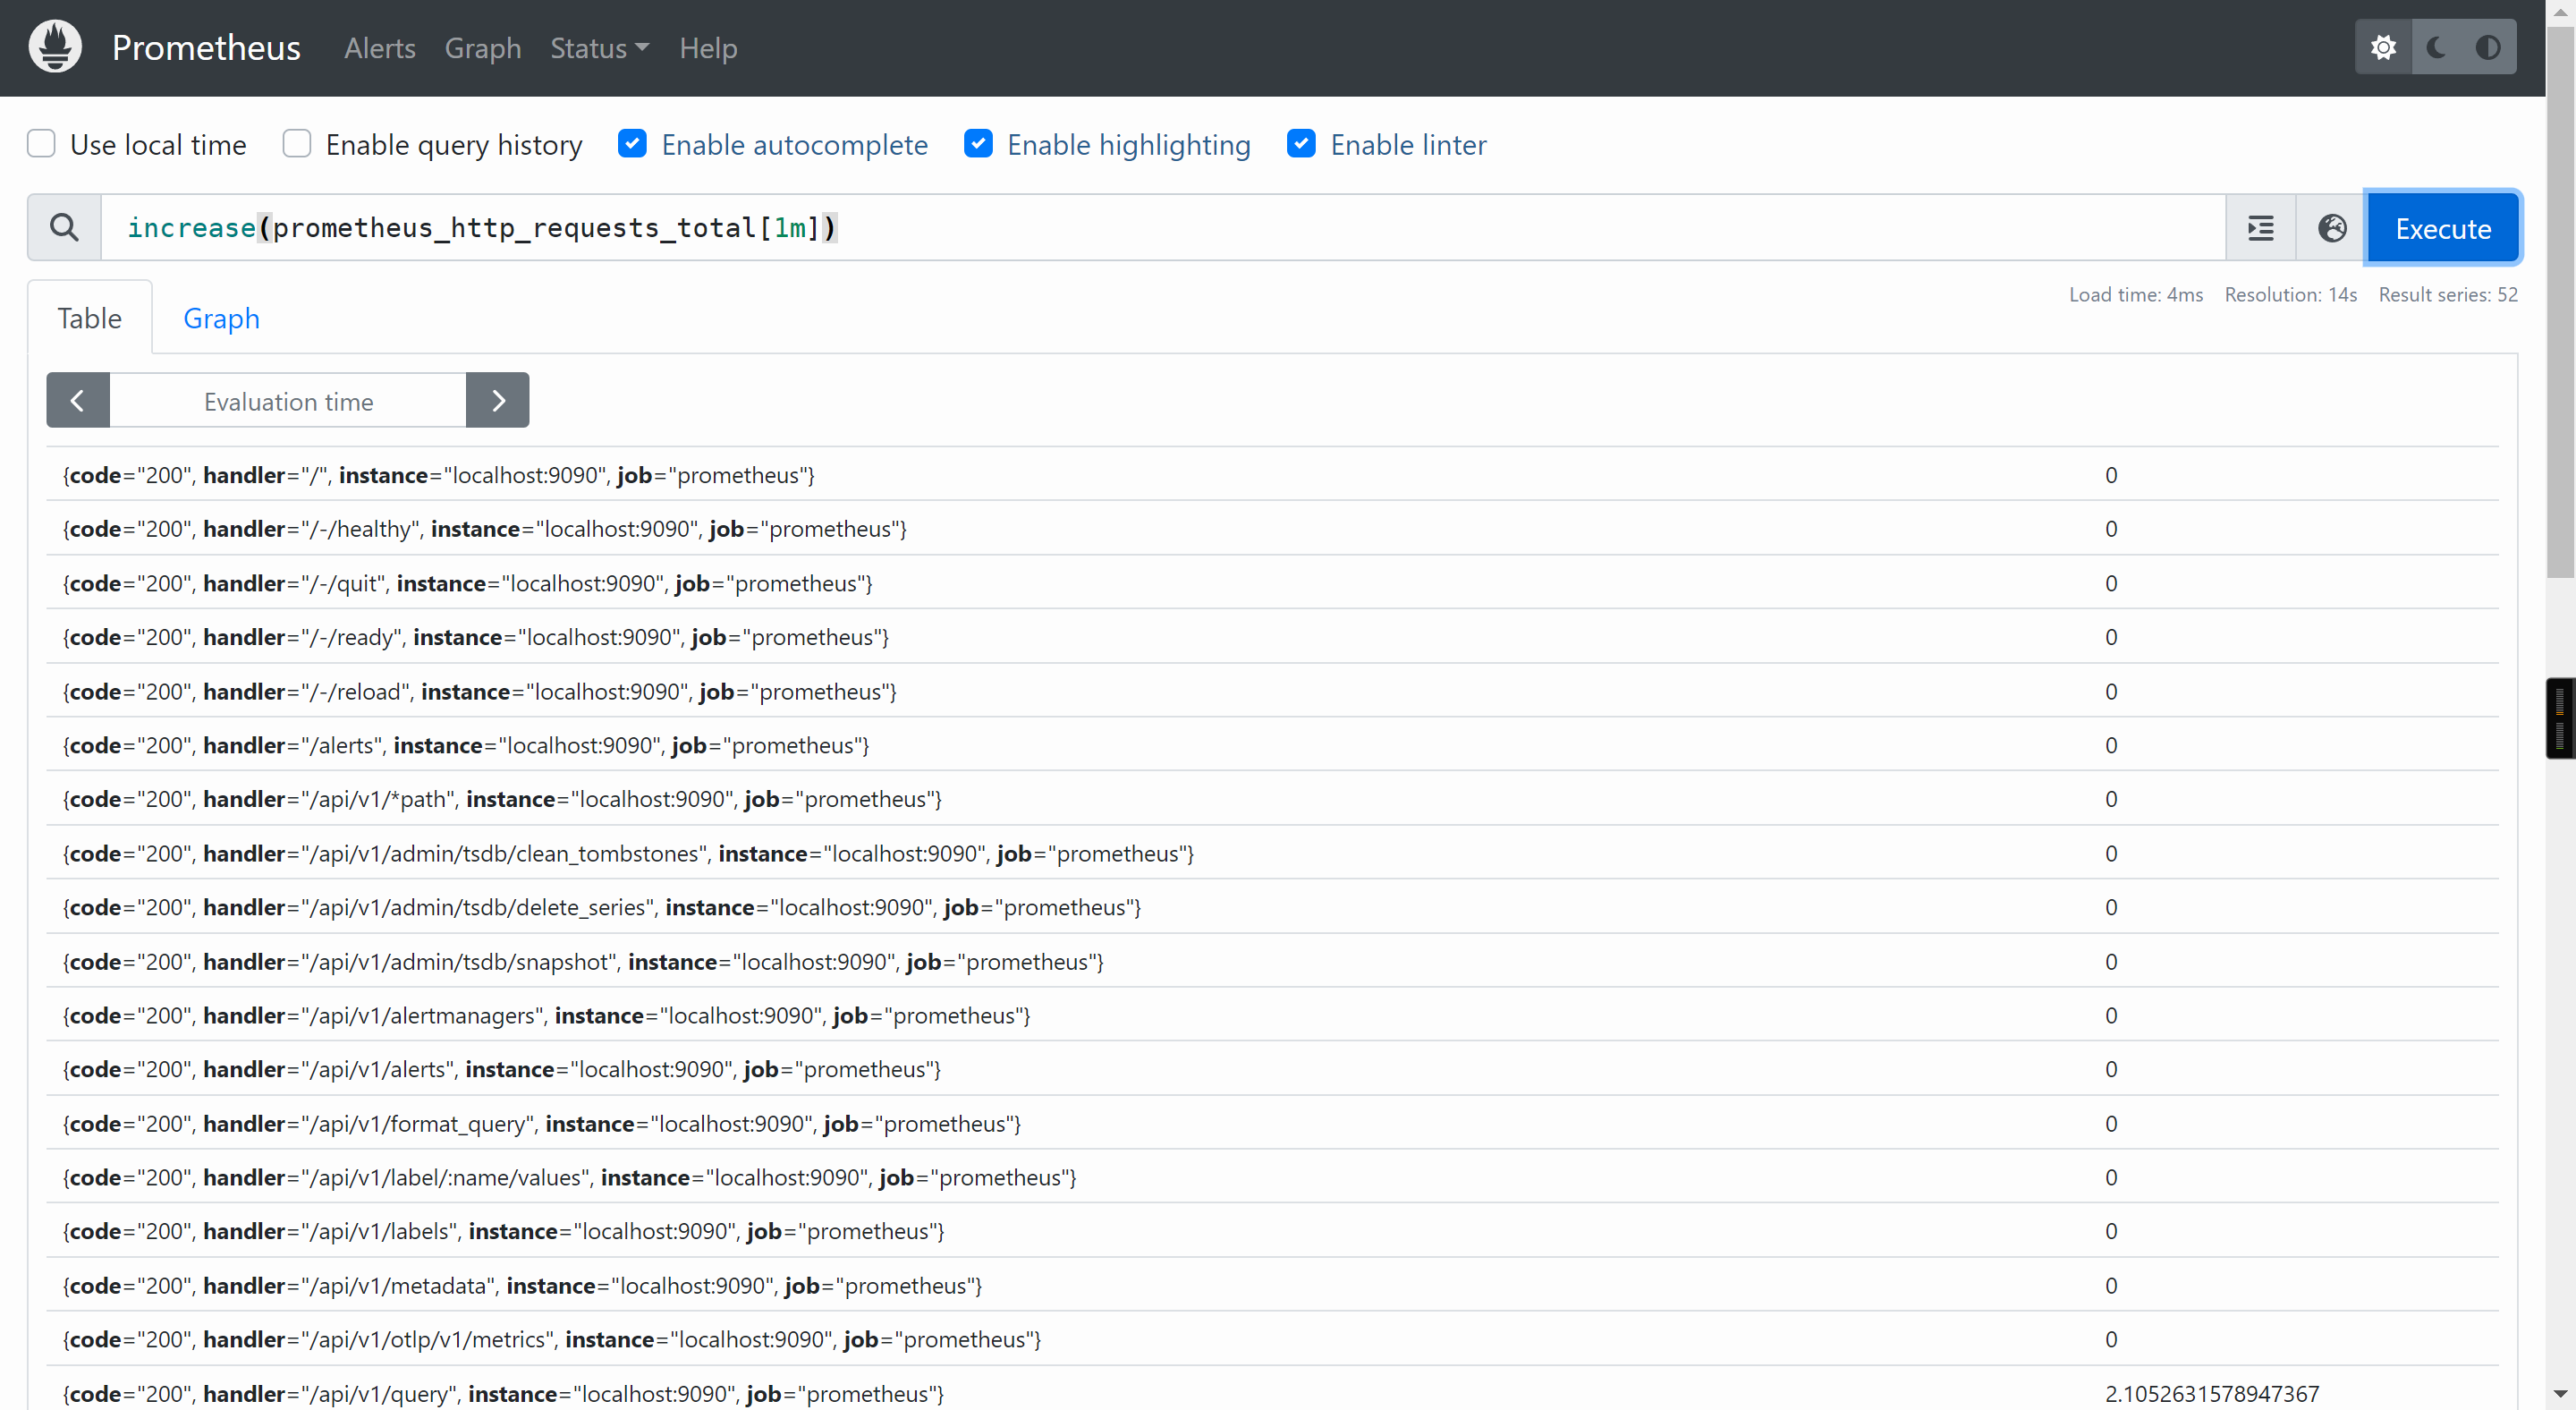
也可以结合increase查看增量,比如: increase(prometheus_http_requests_total[1m])
查询平均访问时间
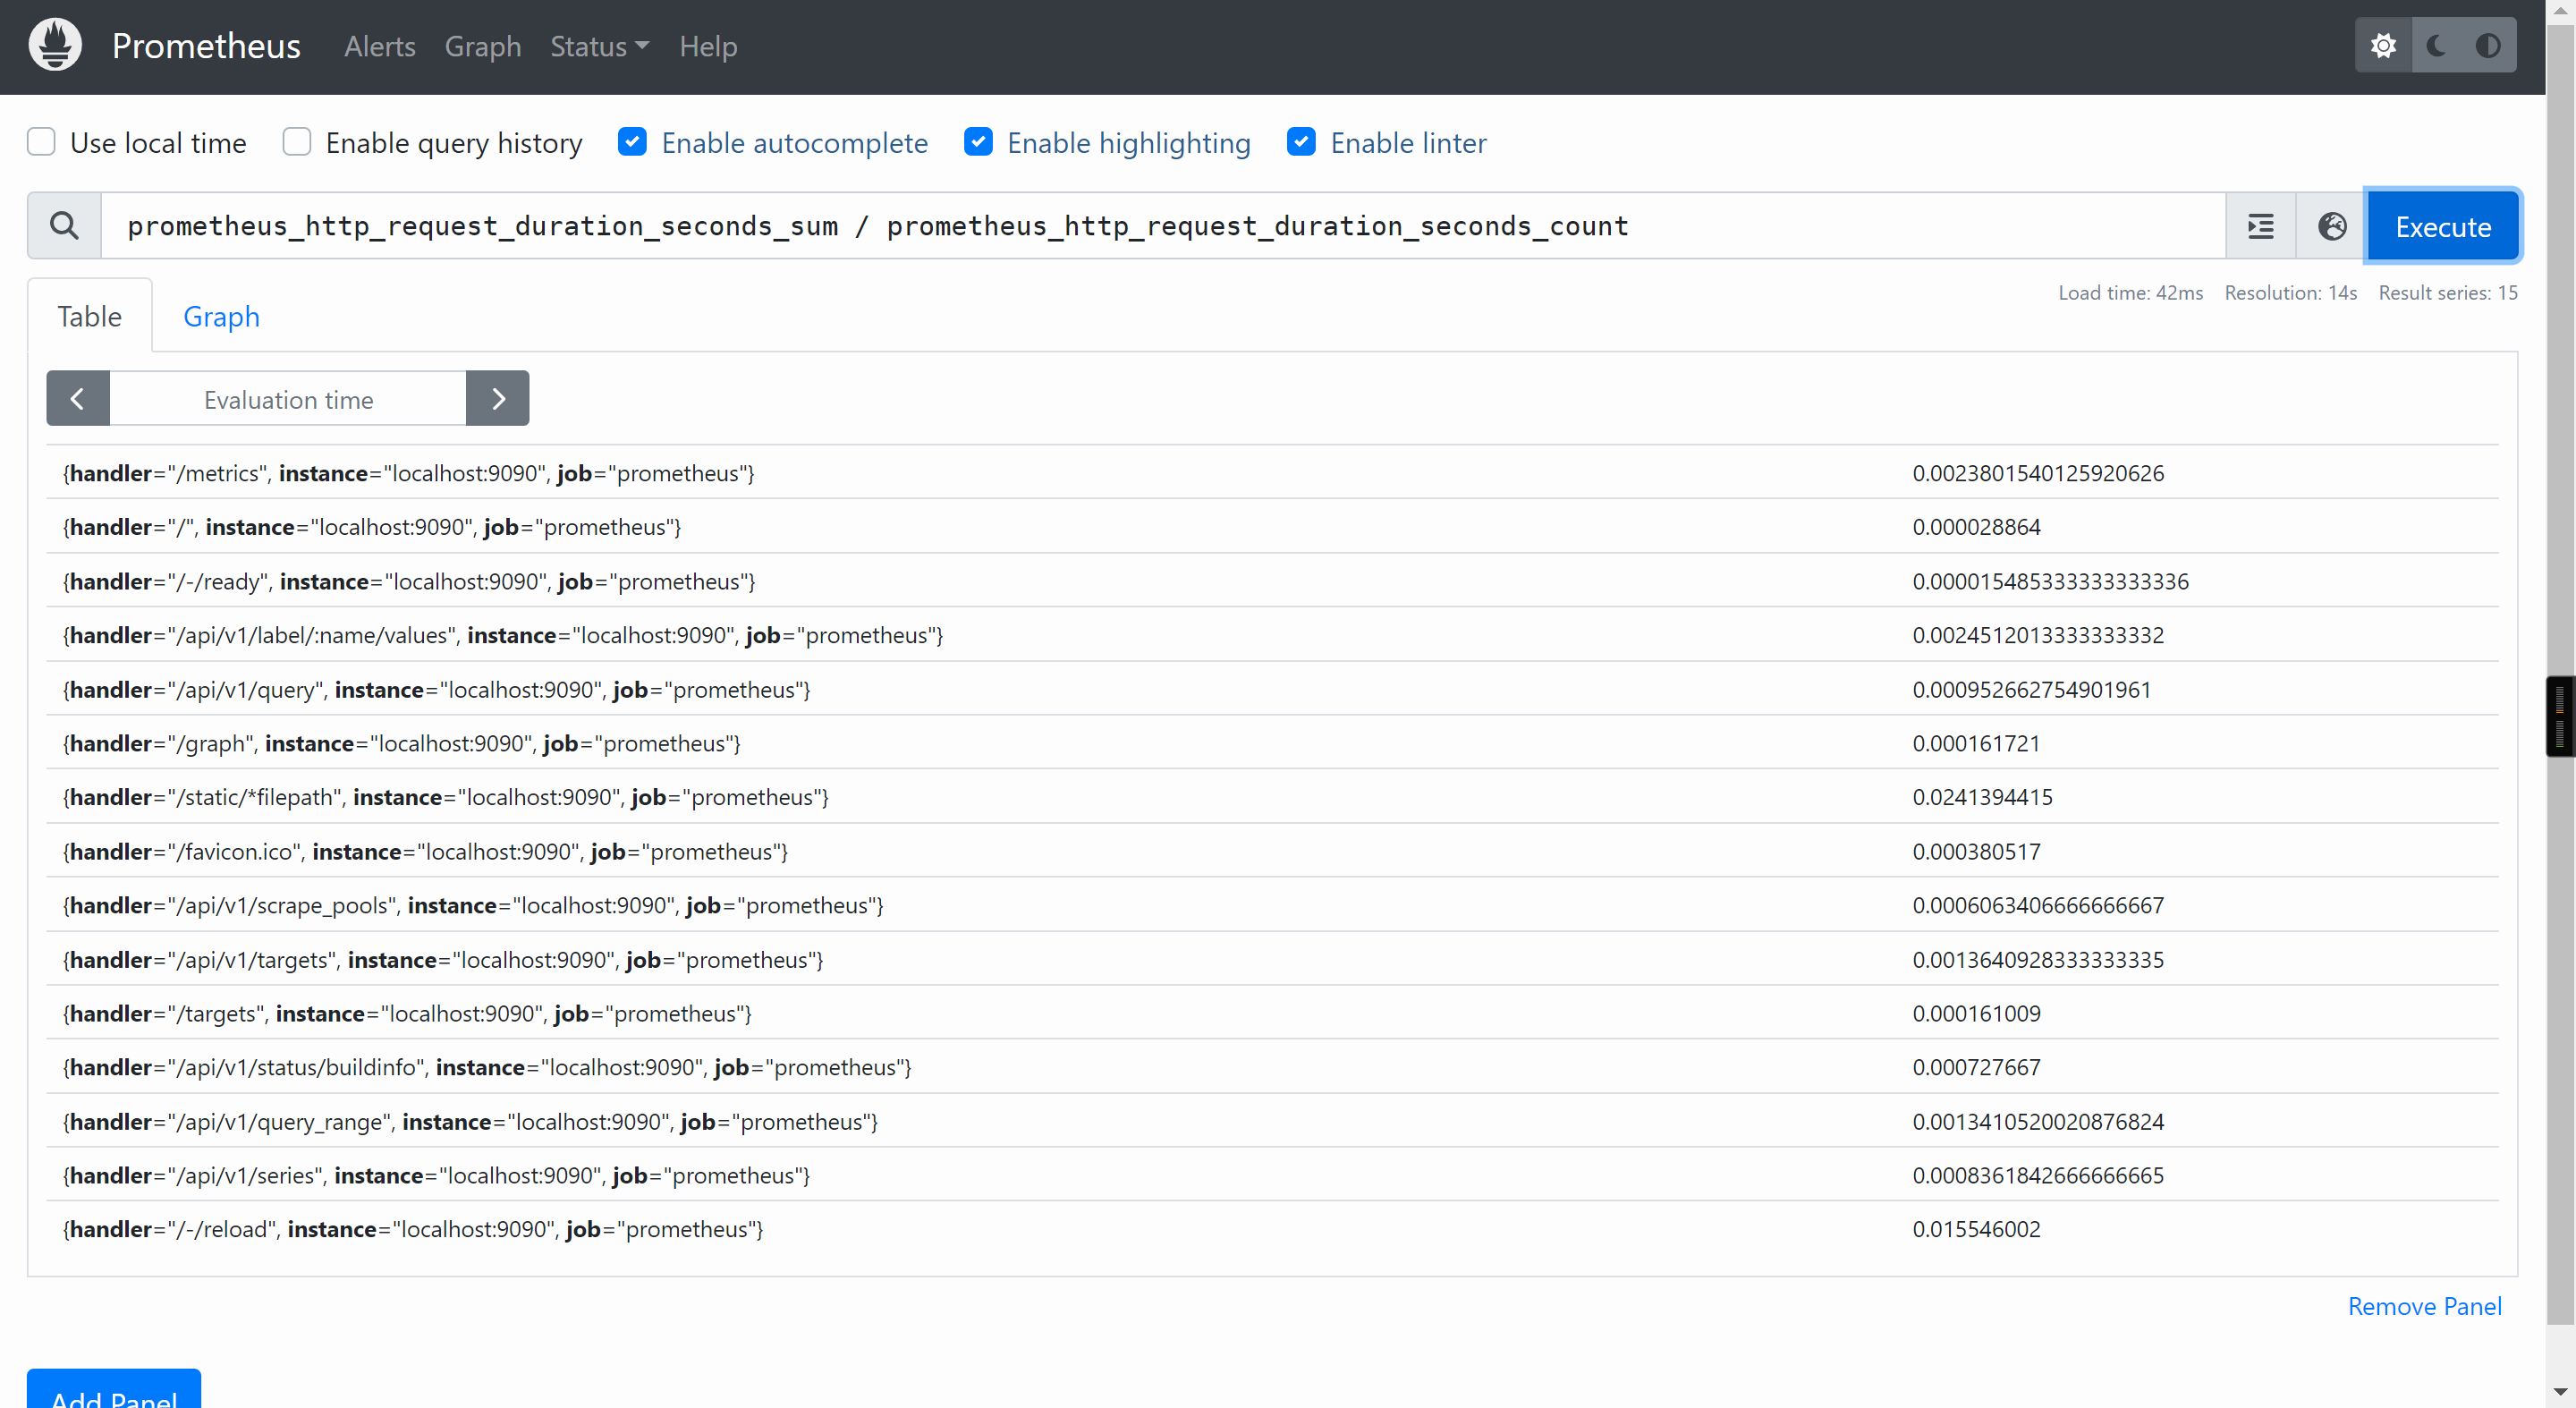
histogram数据类型表示直方图样本观测,通常用于查询"所有观察值的总和","请求持续时间","响应时间"等场景
我们可以使用"prometheus_http_request_duration_seconds_sum / prometheus_http_request_duration_seconds_count"查询平均访问时间

但这种统计方式比较粗糙,用"请求的响应时间/请求的次数",算的是平均响应时间,并不能反应在某个时间段内是否有故障,比如在"12:30~12:35"之间出现大面积服务无法响应,其他时间段都是正常提供服务的,最终使用上面的公式算出来的是没有延迟的,因为5分钟的微小延迟在24小时内平均下来的话可能就可以忽略了,从而运维人员就无法及时发现问题并处理,这对于用户体验是比较差的。
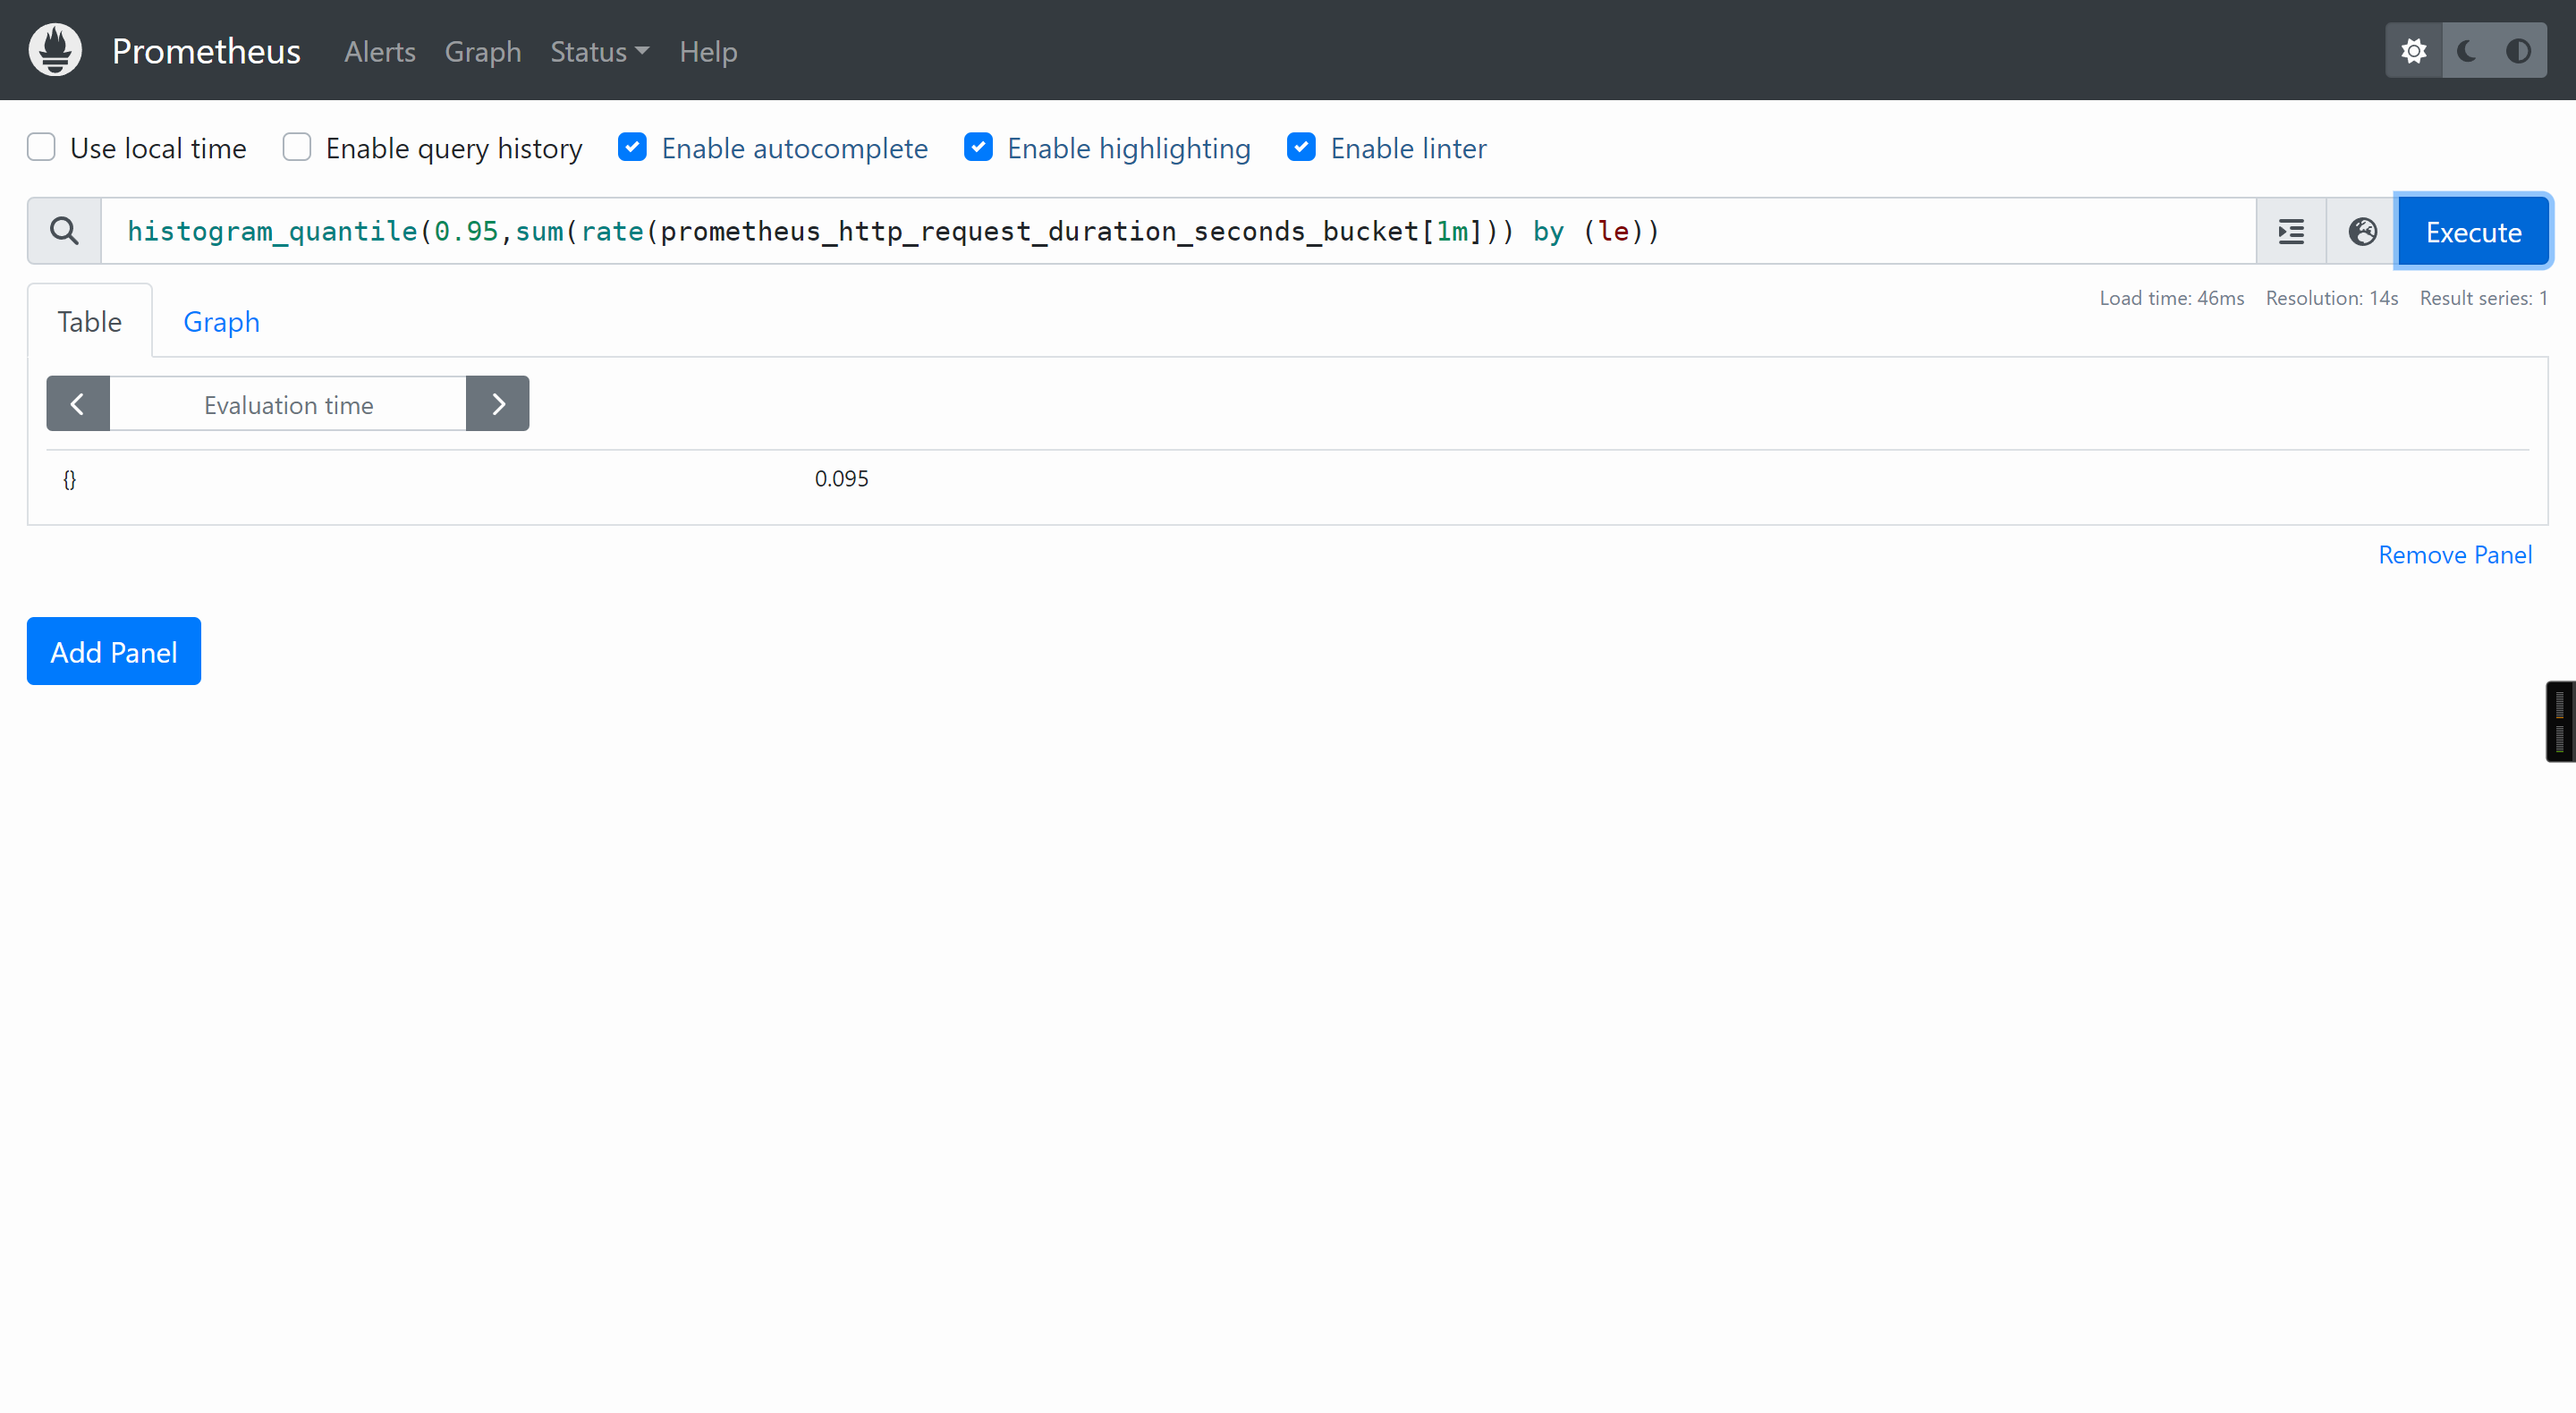
因此Prometheus可以使用histogram数据类型可以采用分位值的方式随机采样短时间范围内的数据,从而及时发现问题,这需要配合histogram_quantile函数来使用。
举个例子: HTTP请求的延迟柱状图(下面的"0.95"表示的是分位值,你可以根据需求自行修改即可。)

相比于histogram需要结合histogram_quantile函数进行实时计算结果,summary数据类型的数据是分值值的一个结果。
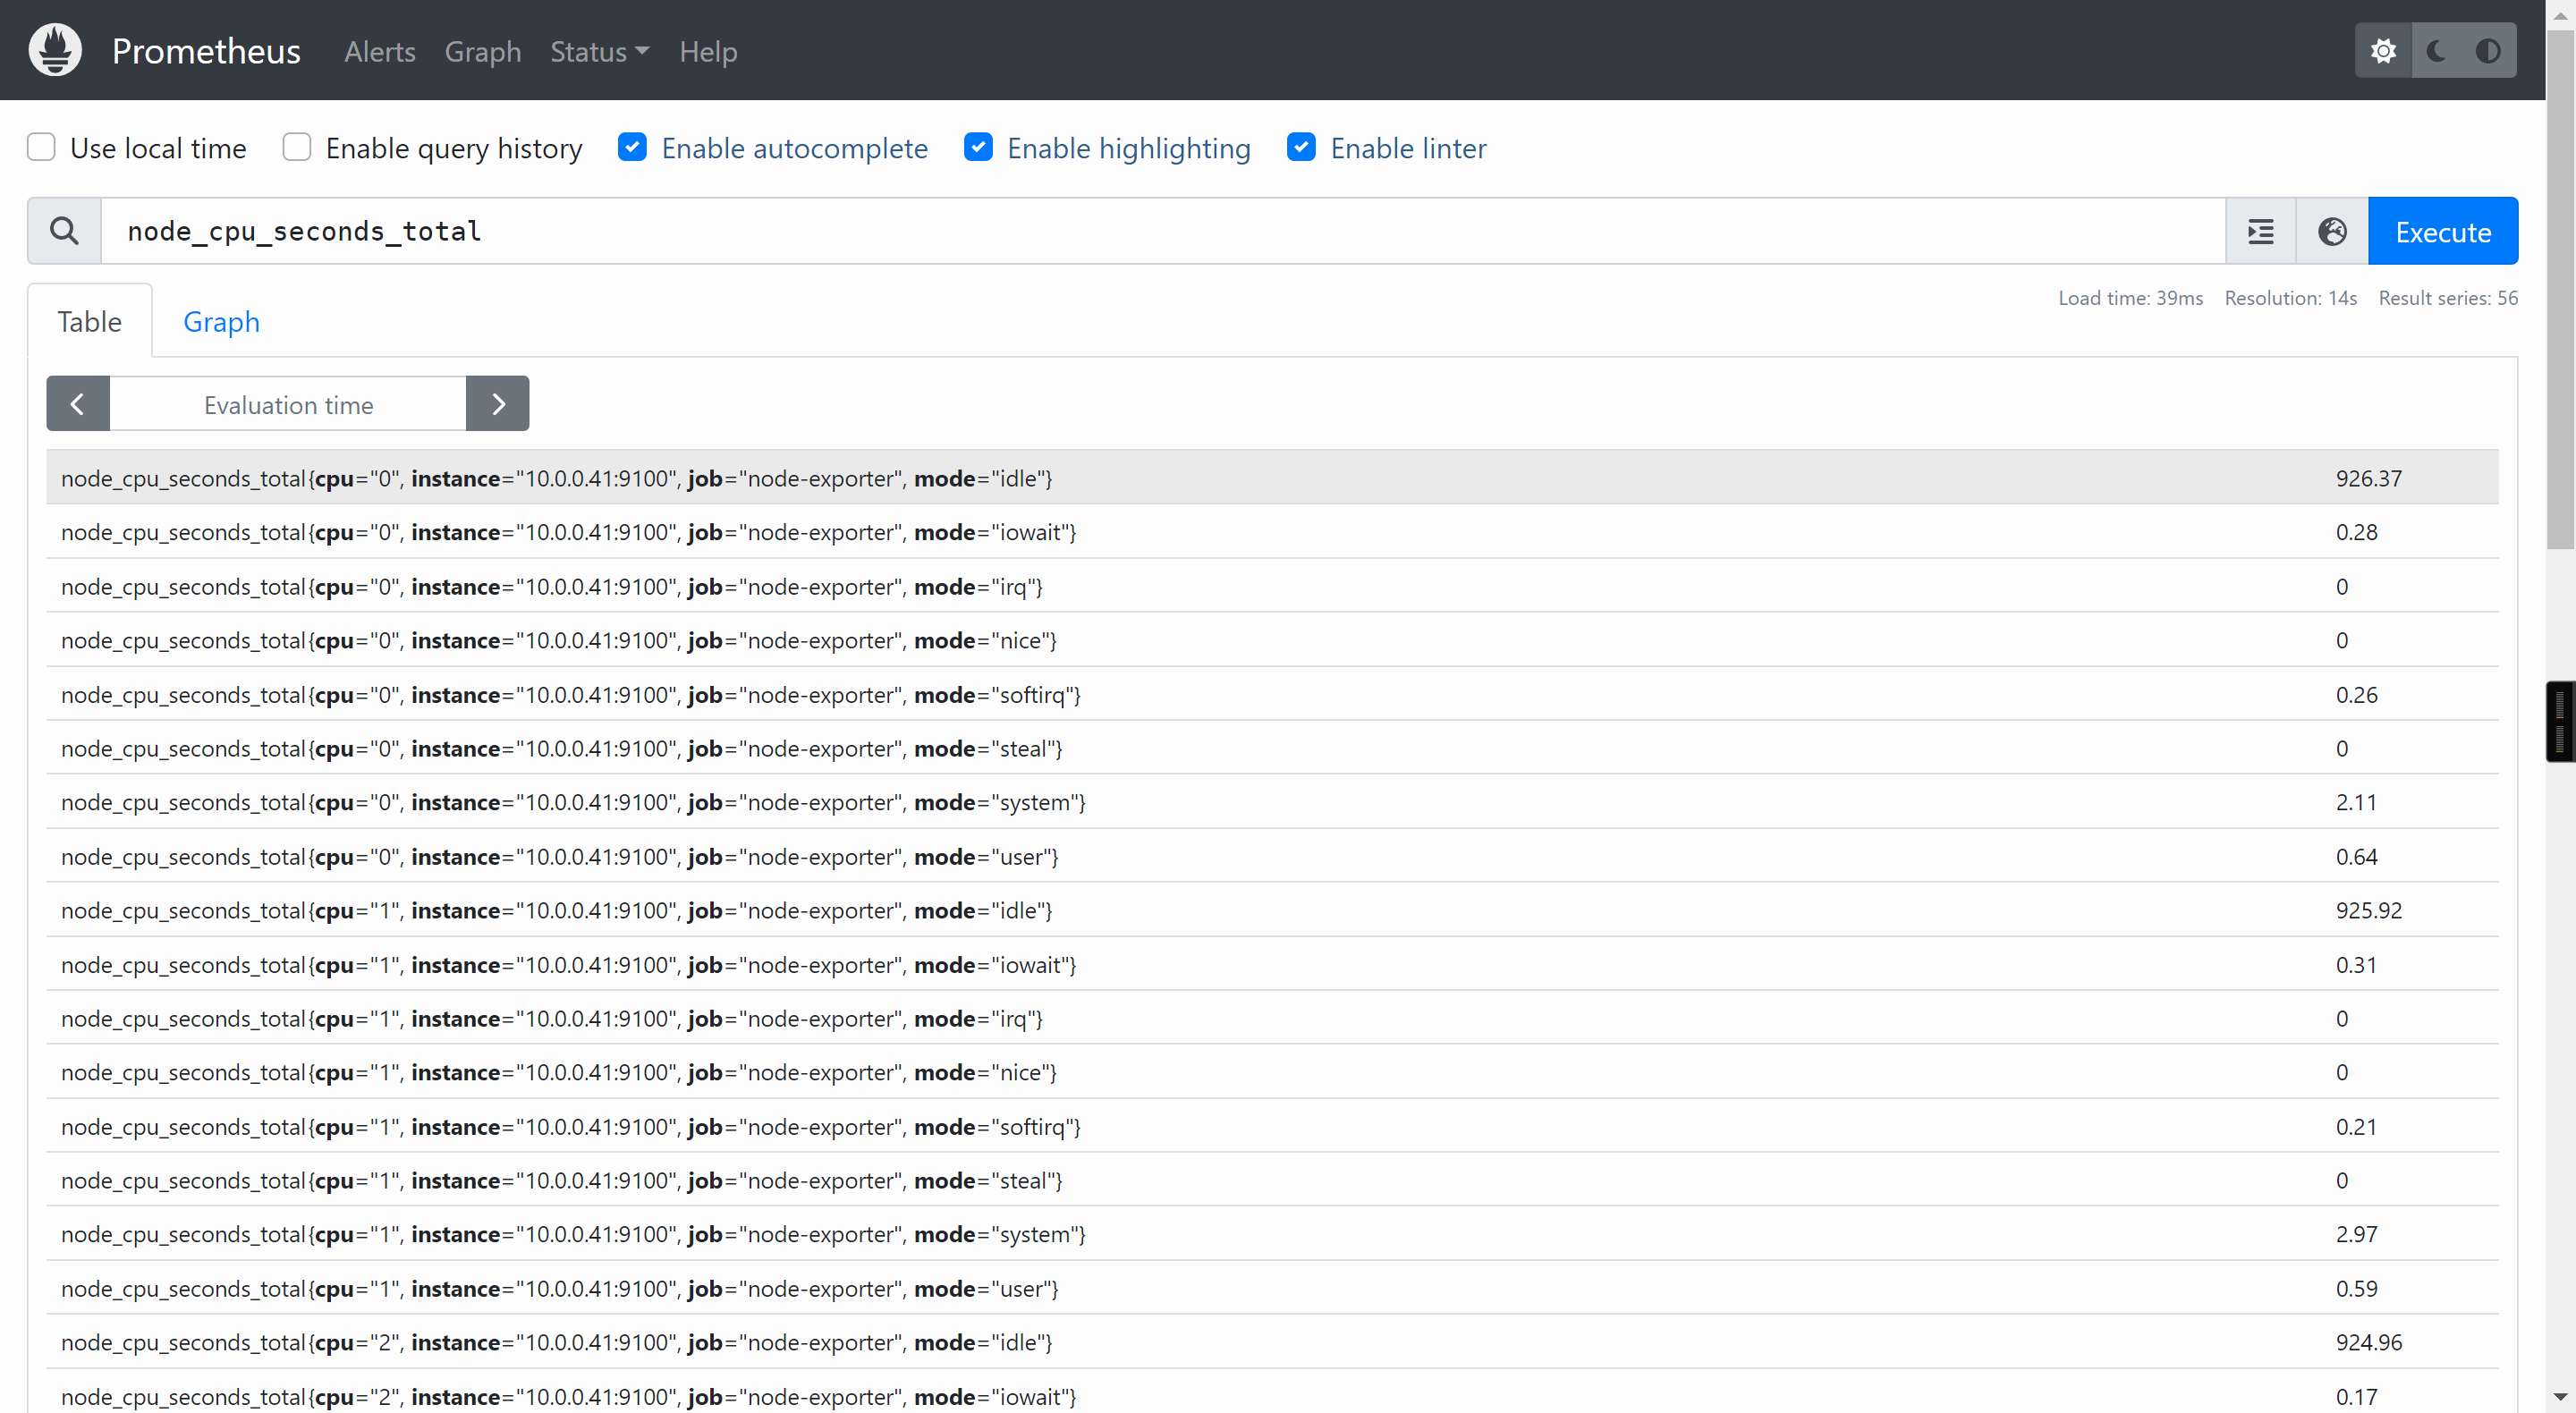
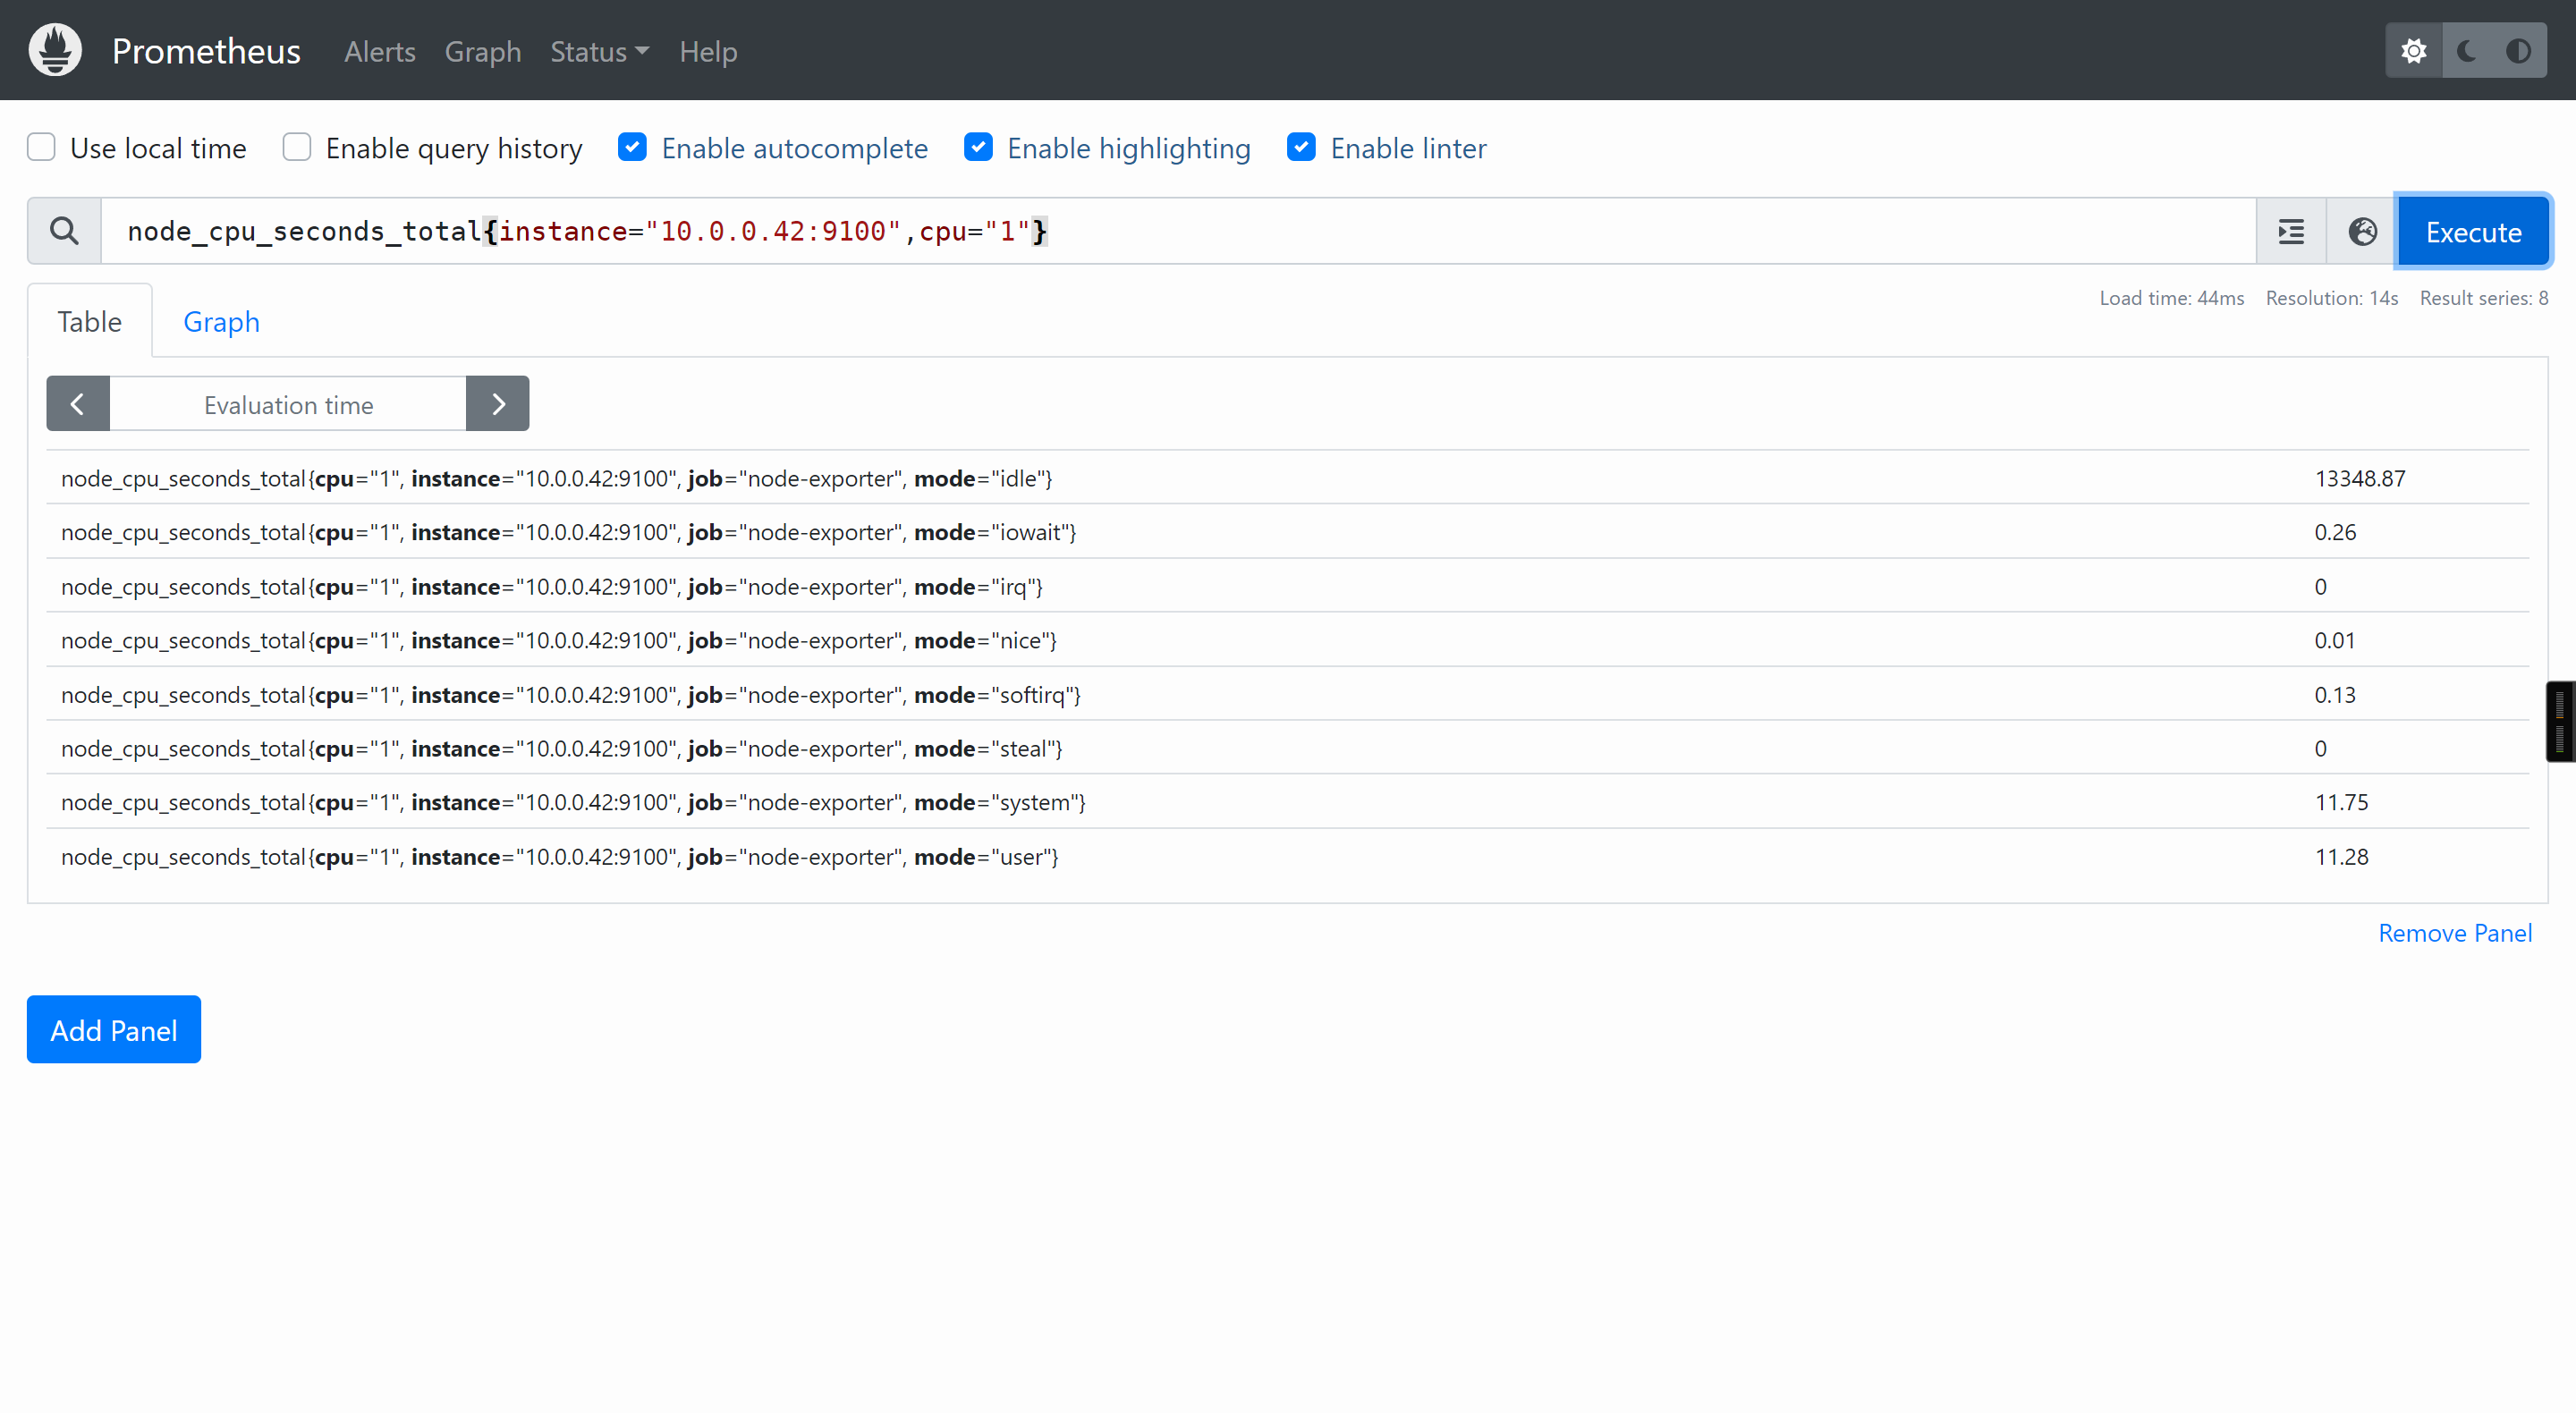
node_cpu_seconds_total{instance="10.0.0.42:9100",cpu="1"}
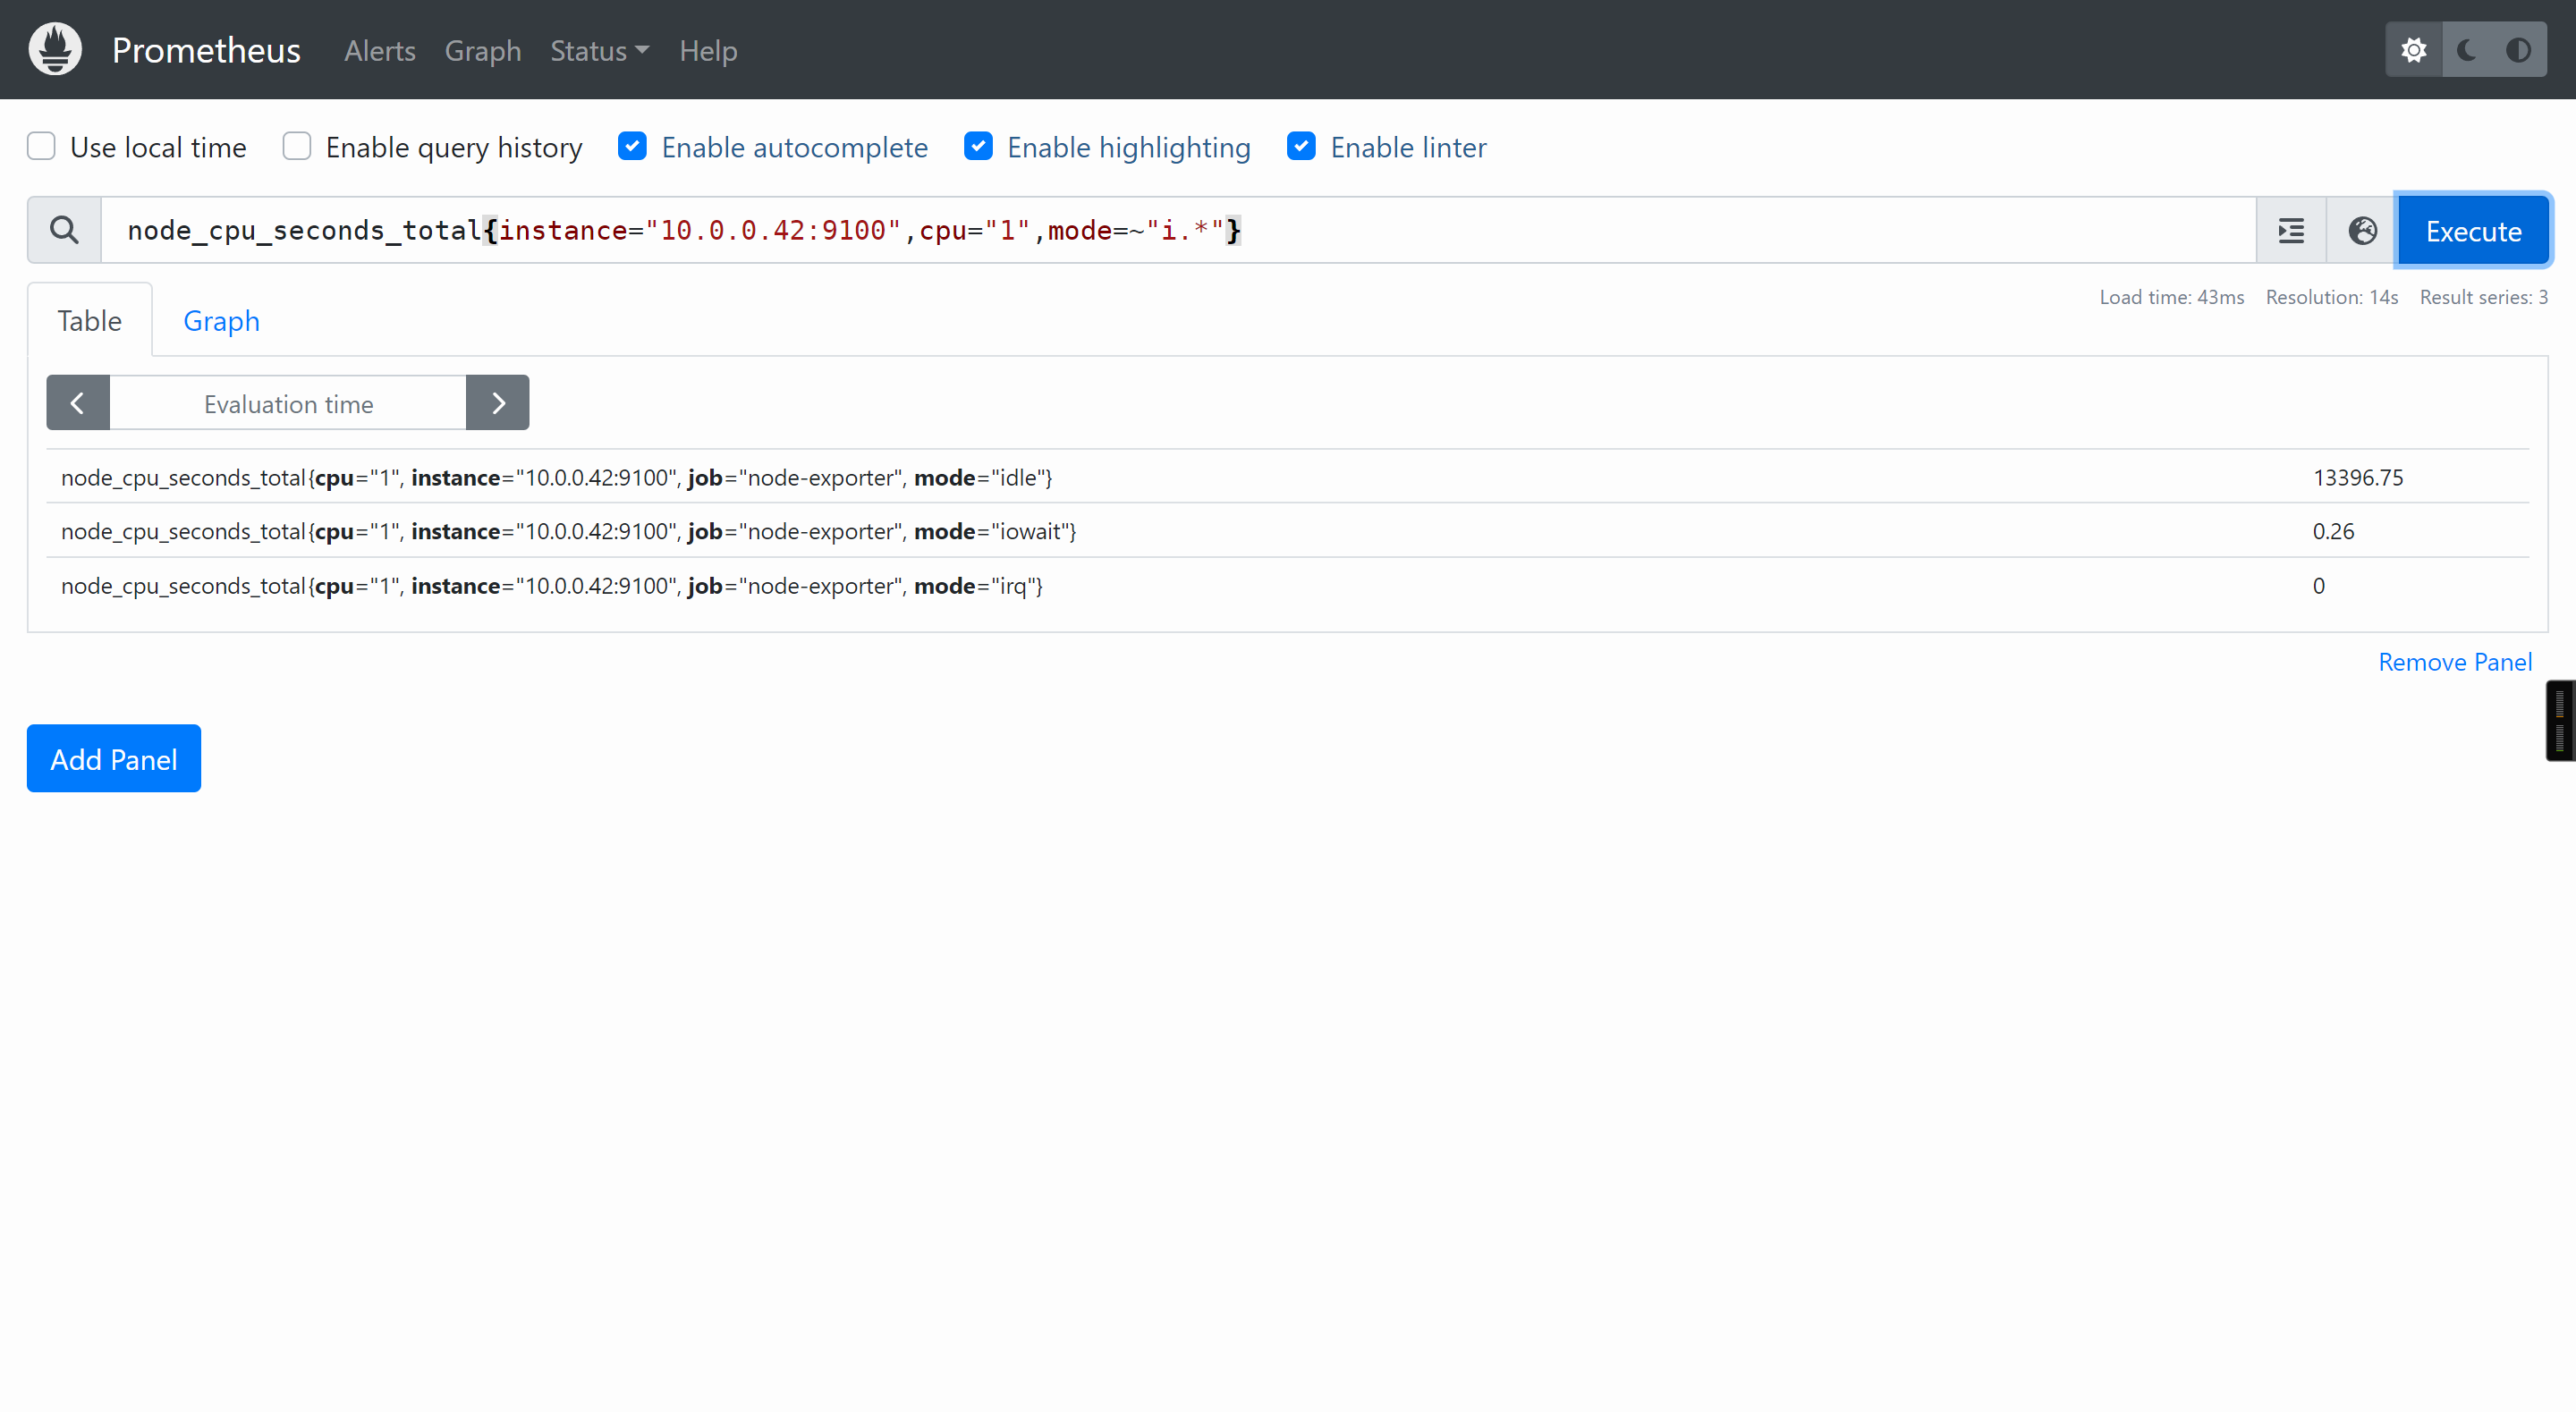
node_cpu_seconds_total{instance="10.0.0.42:9100",cpu="1",mode=~"i.*"}
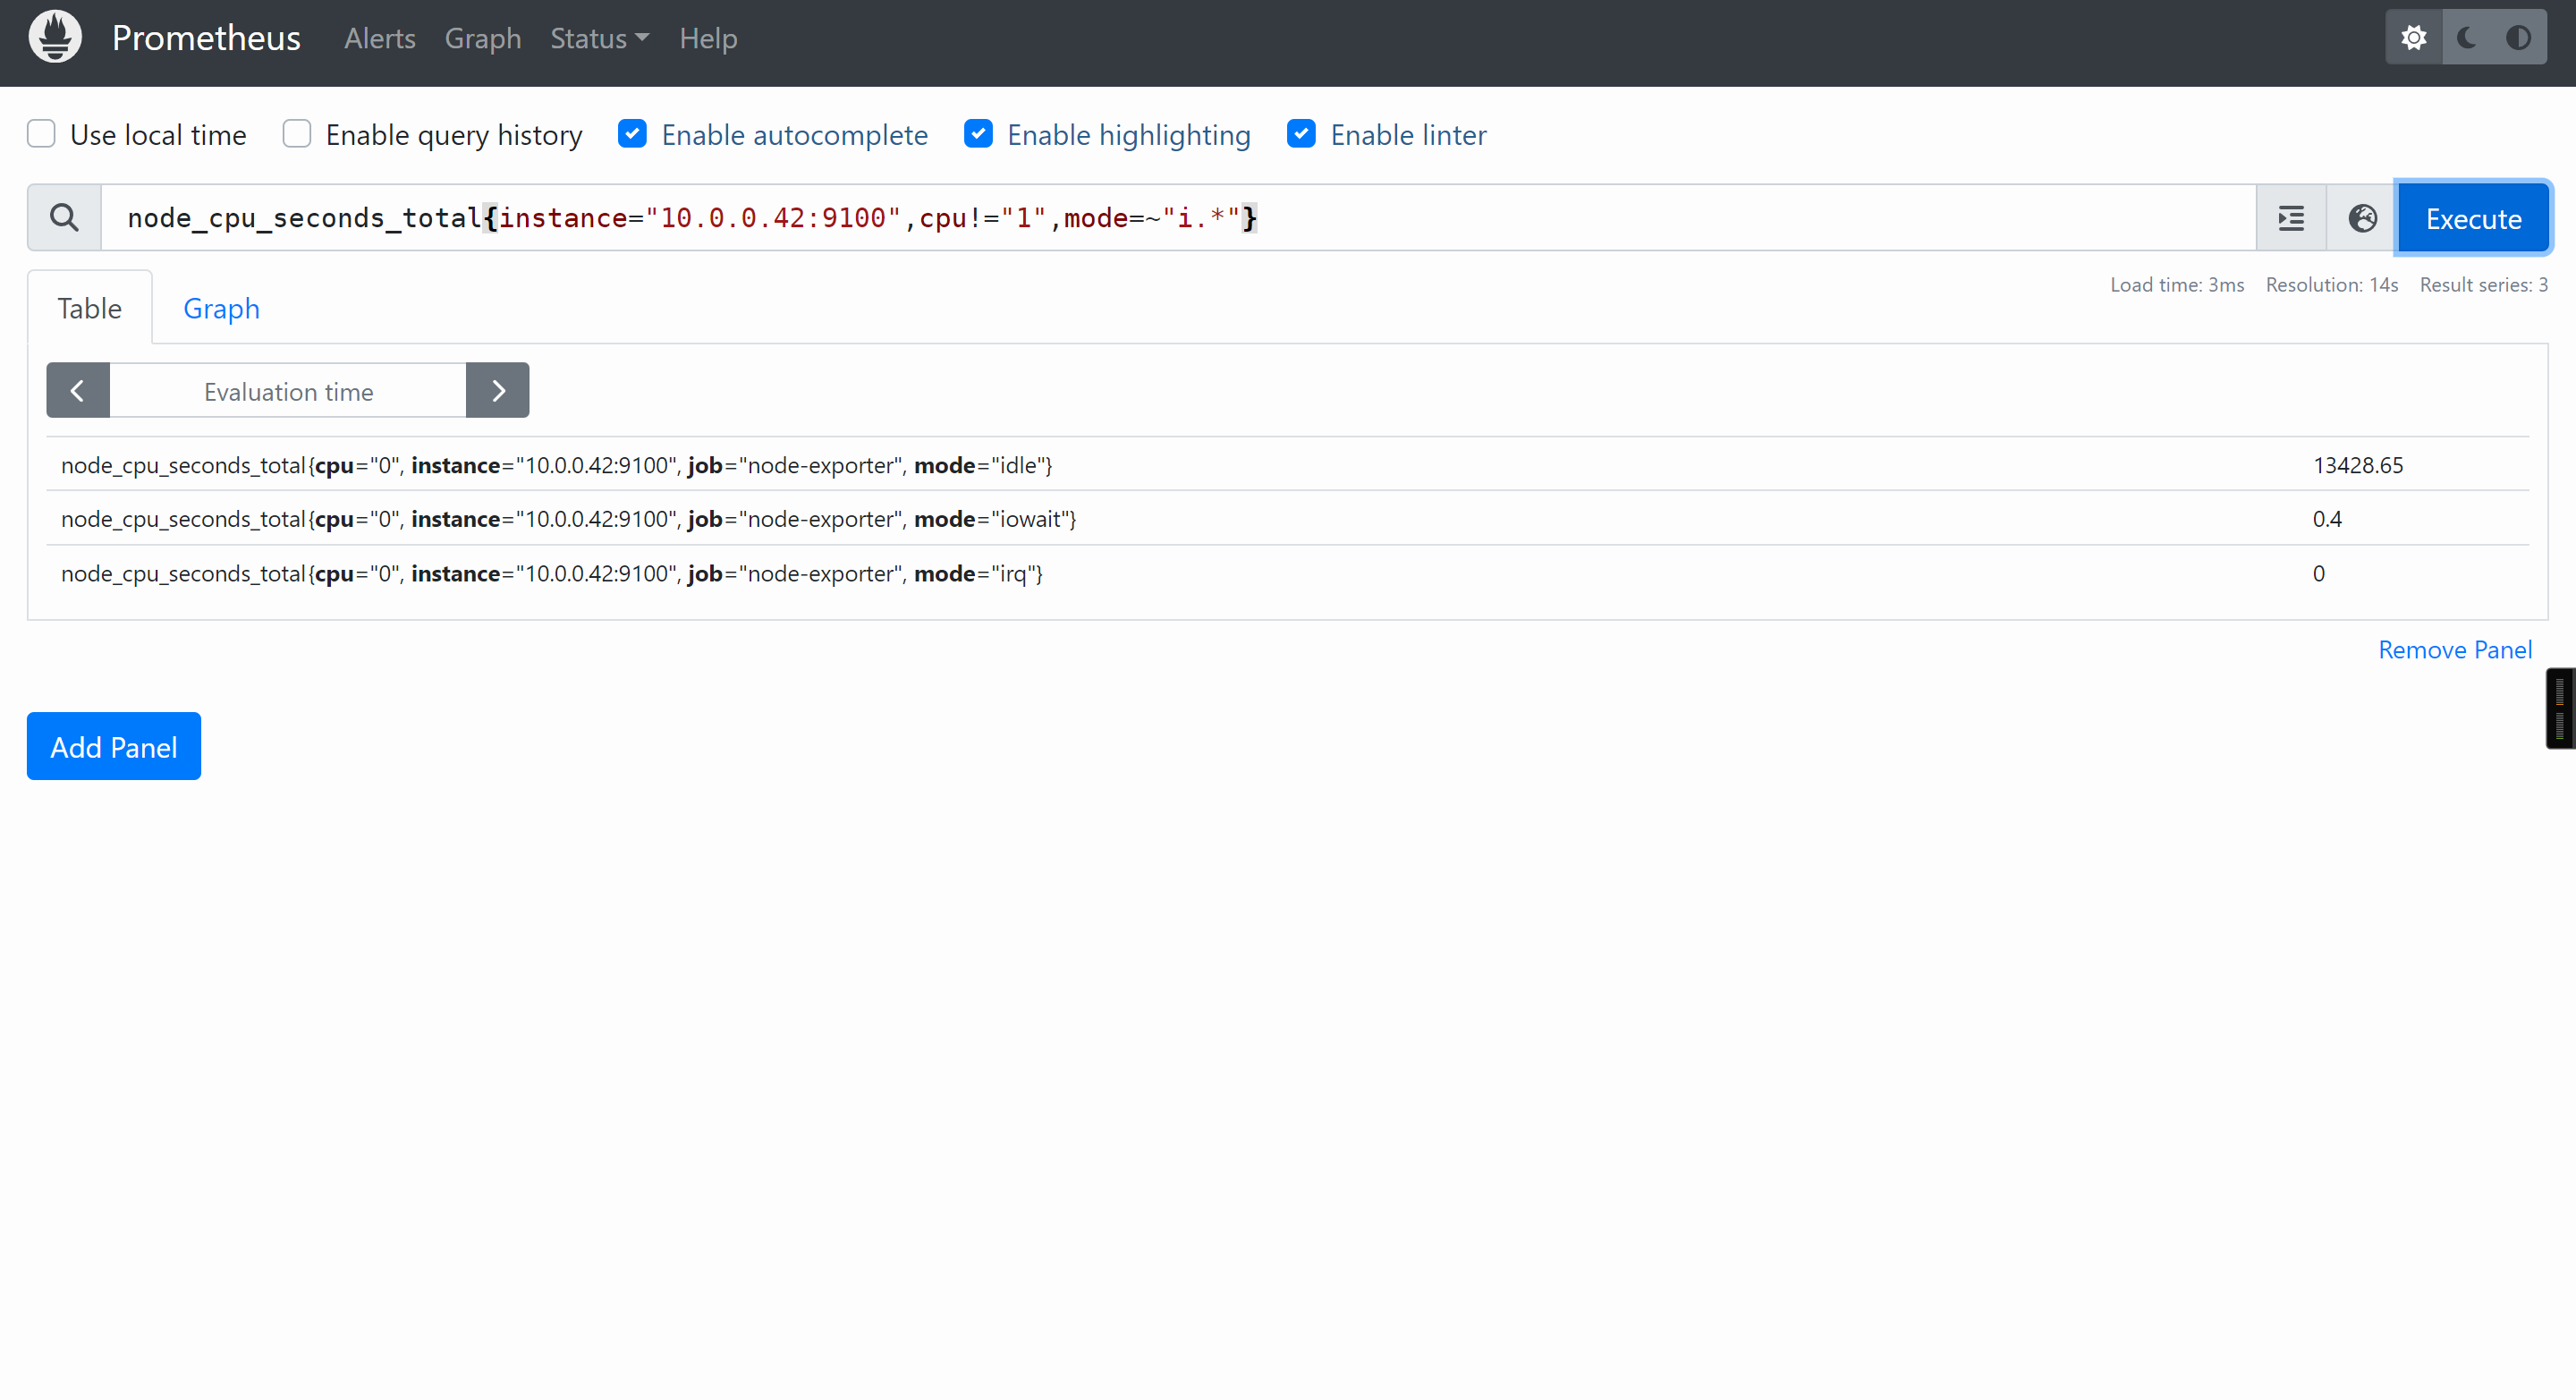
node_cpu_seconds_total{instance="10.0.0.42:9100",cpu!="1",mode=~"i.*"}
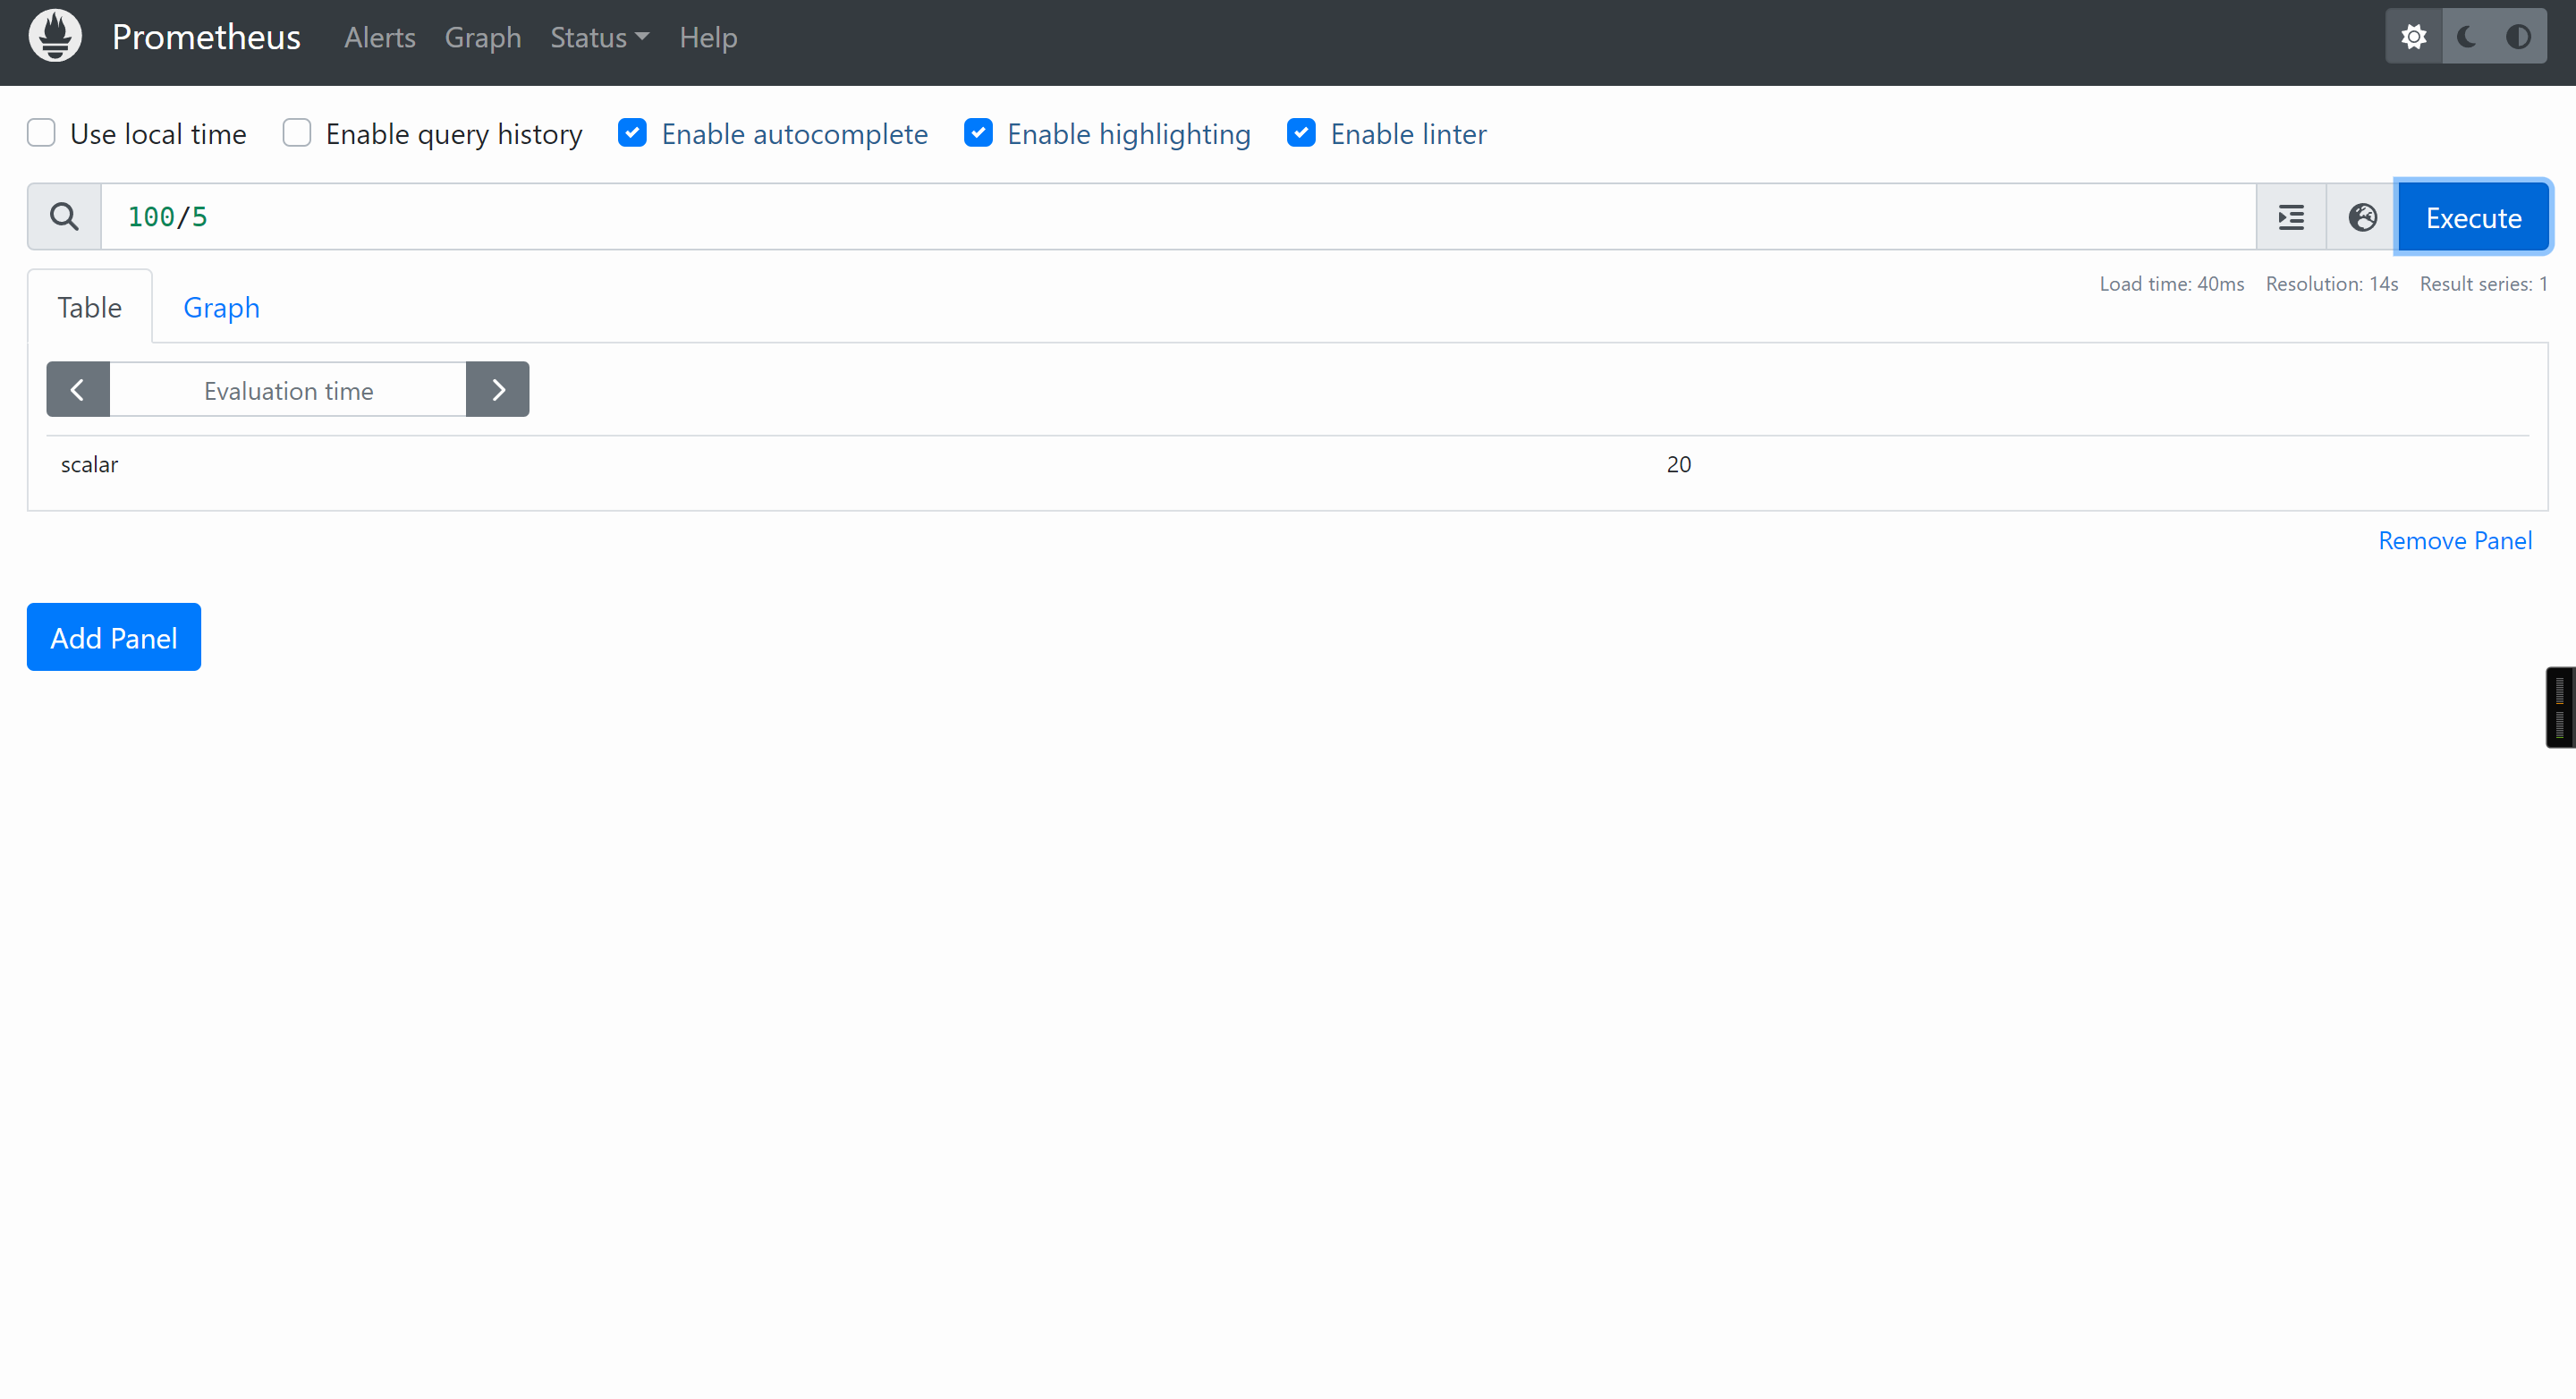
100/5
10+20
参考链接:
https://prometheus.io/docs/prometheus/latest/querying/operators/
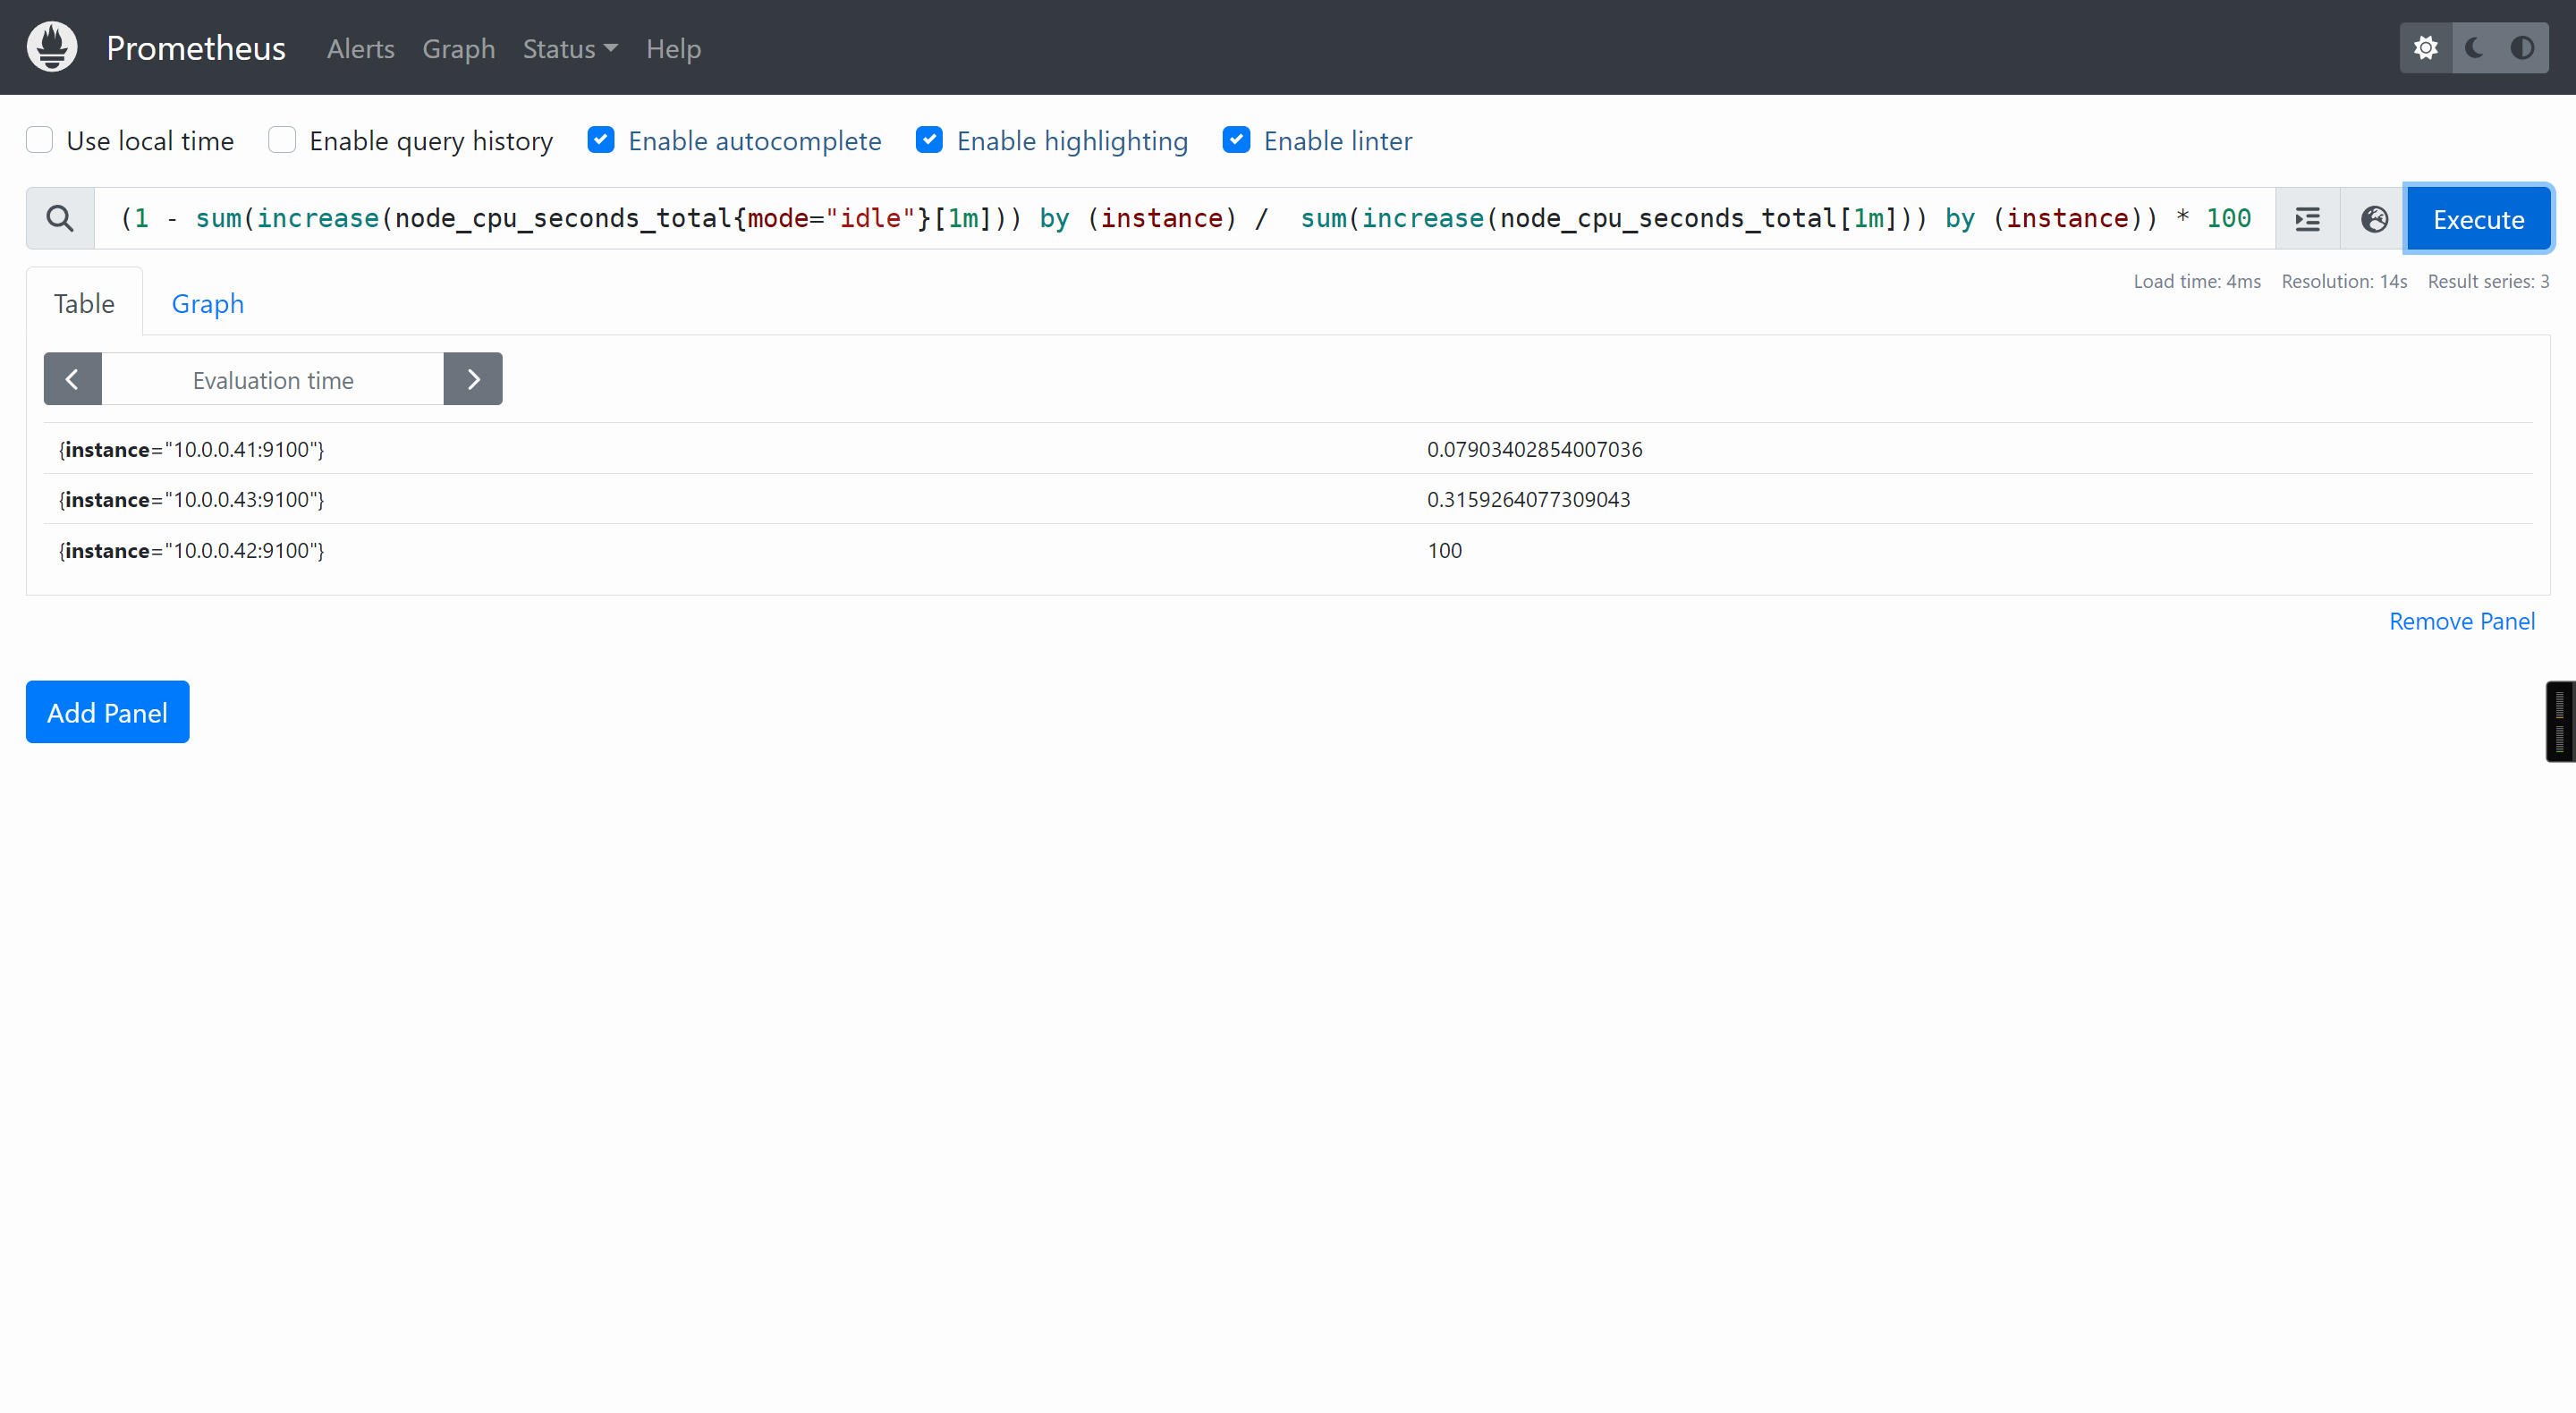
[root@node-exporter42 ~]# apt -y install stress
[root@node-exporter42 ~]# stress --cpu 8 --io 4 --vm 2 --vm-bytes 128M --timeout 20m
(1 - sum(increase(node_cpu_seconds_total{mode="idle"}[1m])) by (instance) / sum(increase(node_cpu_seconds_total[1m])) by (instance)) * 100
(time() - node_boot_time_seconds) / 60
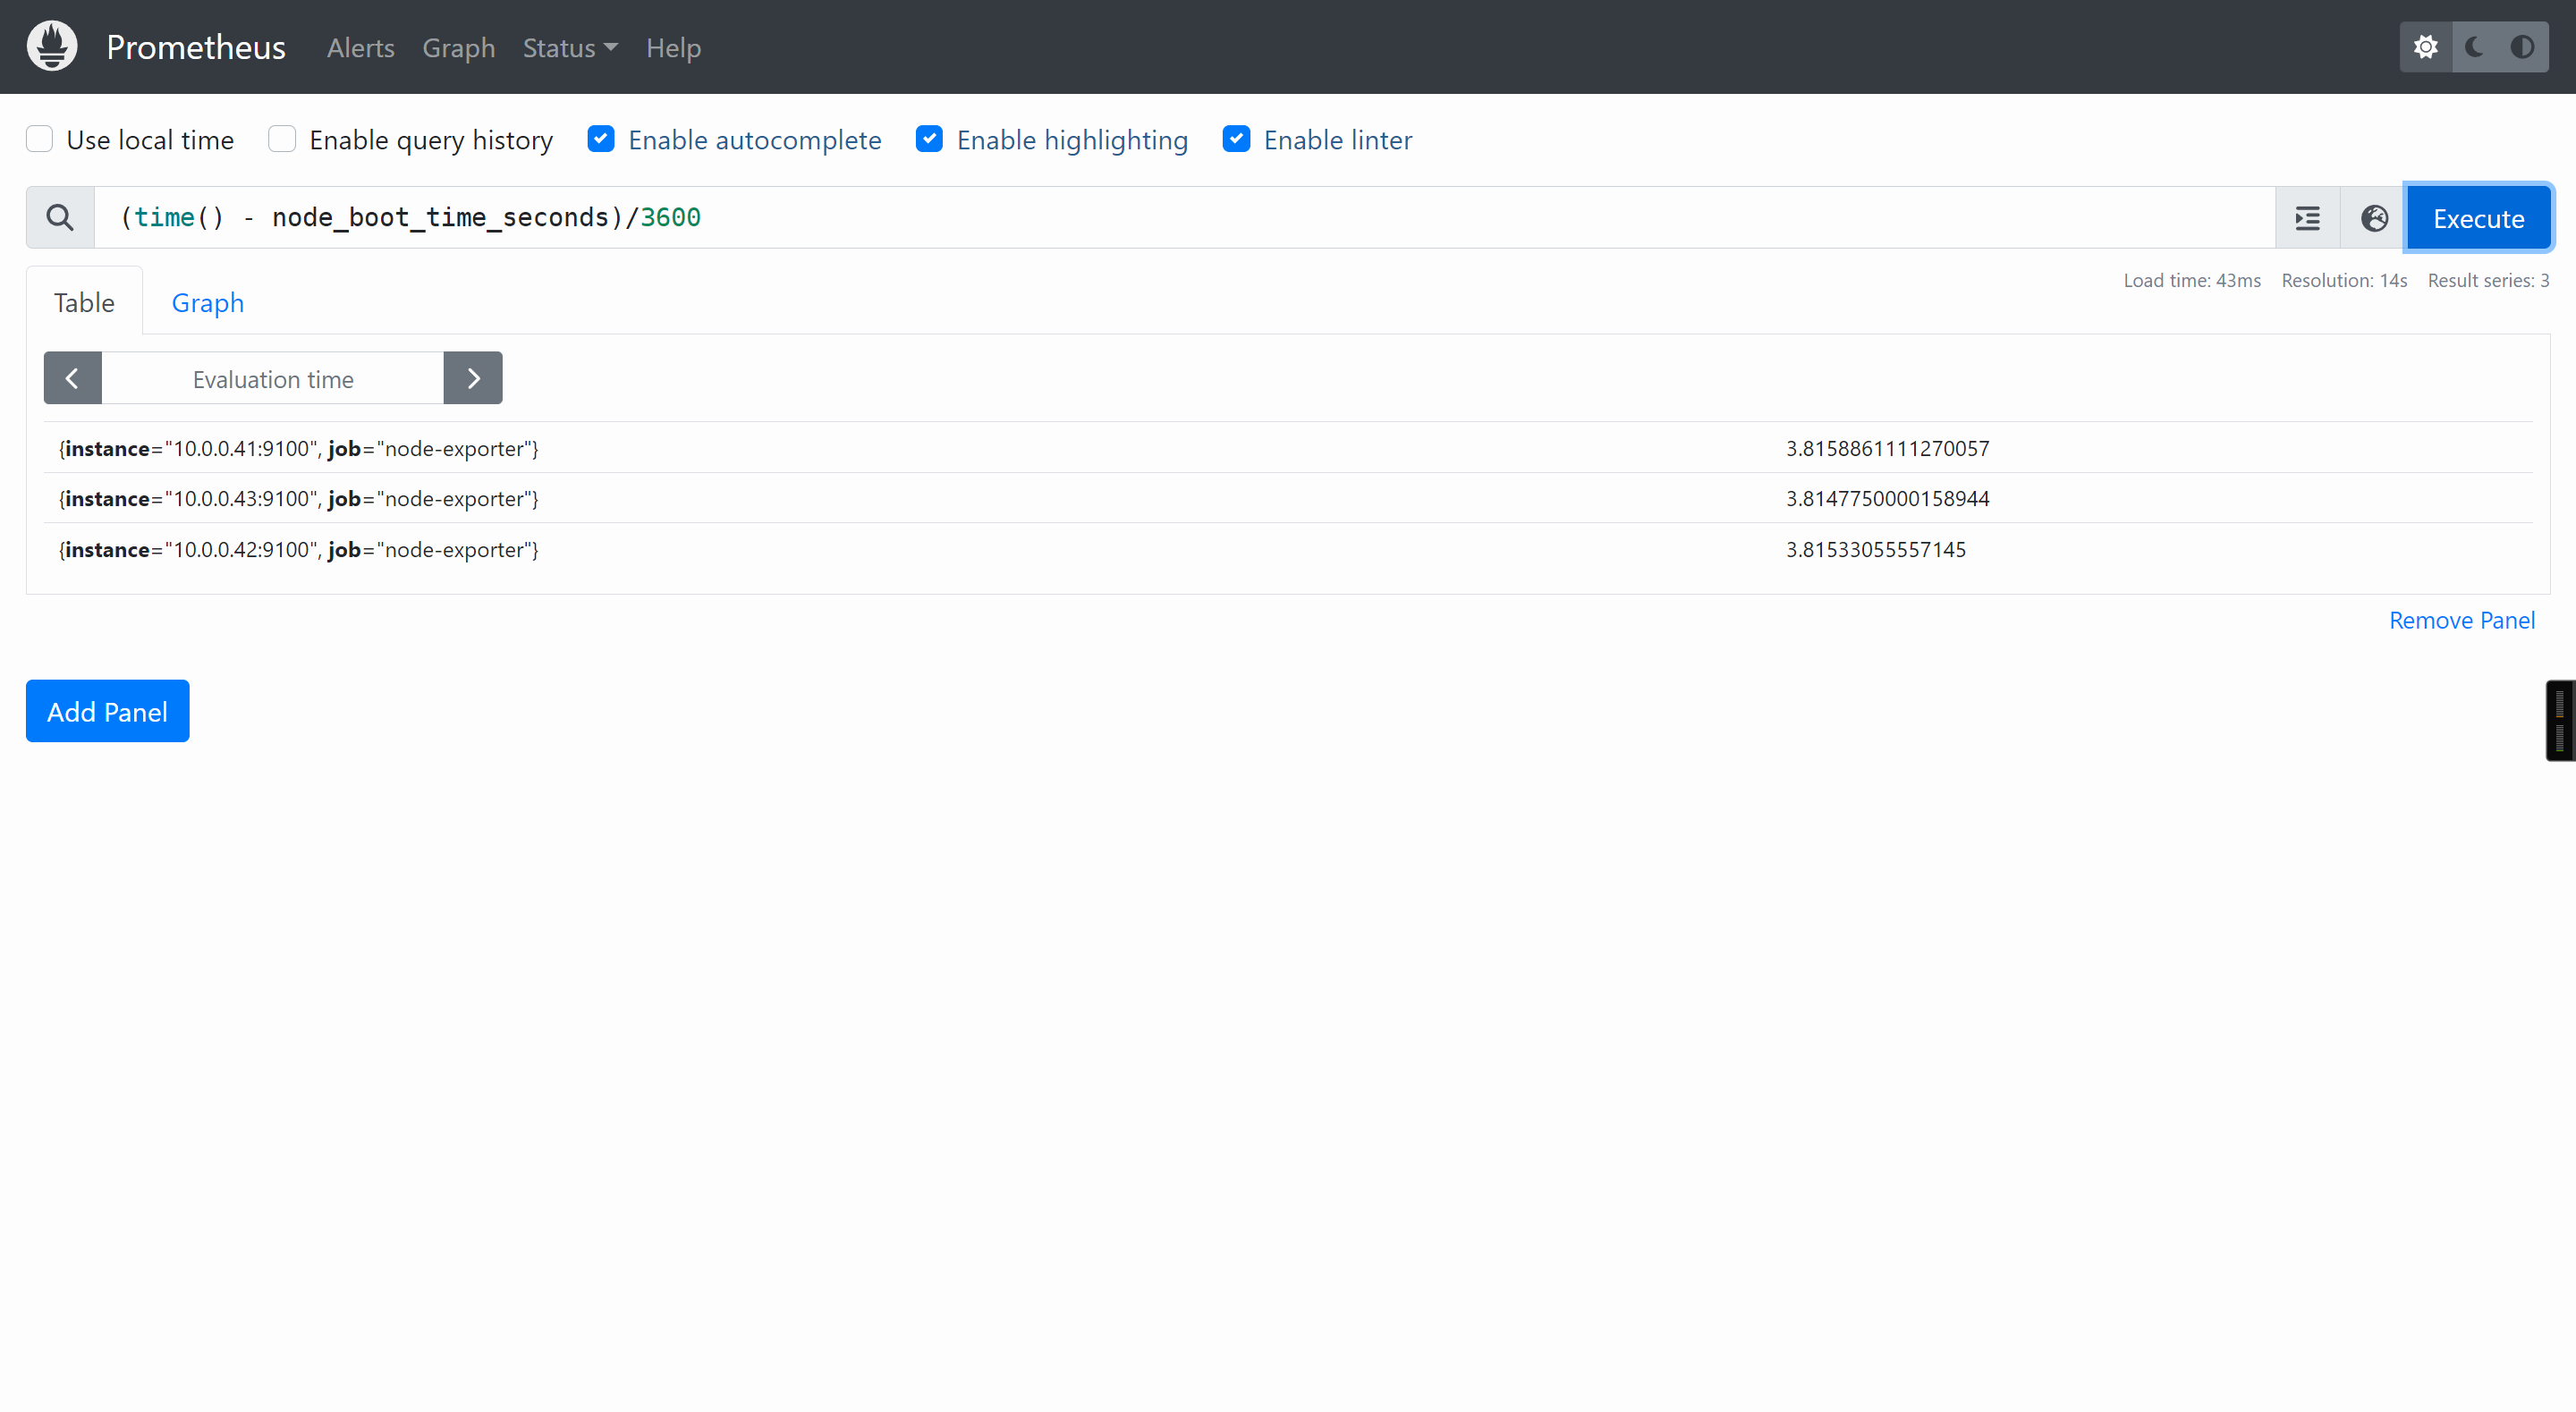
(time() - node_boot_time_seconds)/3600
参考链接:
https://prometheus.io/docs/prometheus/latest/querying/functions/
Prometheus的webUi使用的两个痛点:
综上所述,Prometheus的webUI对'新手'来说并不友好
参考链接:
[root@prometheus-server31 ~]# apt-get install -y adduser libfontconfig1 musl
[root@prometheus-server31 ~]# wget https://dl.grafana.com/enterprise/release/grafana-enterprise_9.5.21_amd64.deb
[root@prometheus-server31 ~]# dpkg -i grafana-enterprise_9.5.21_amd64.deb
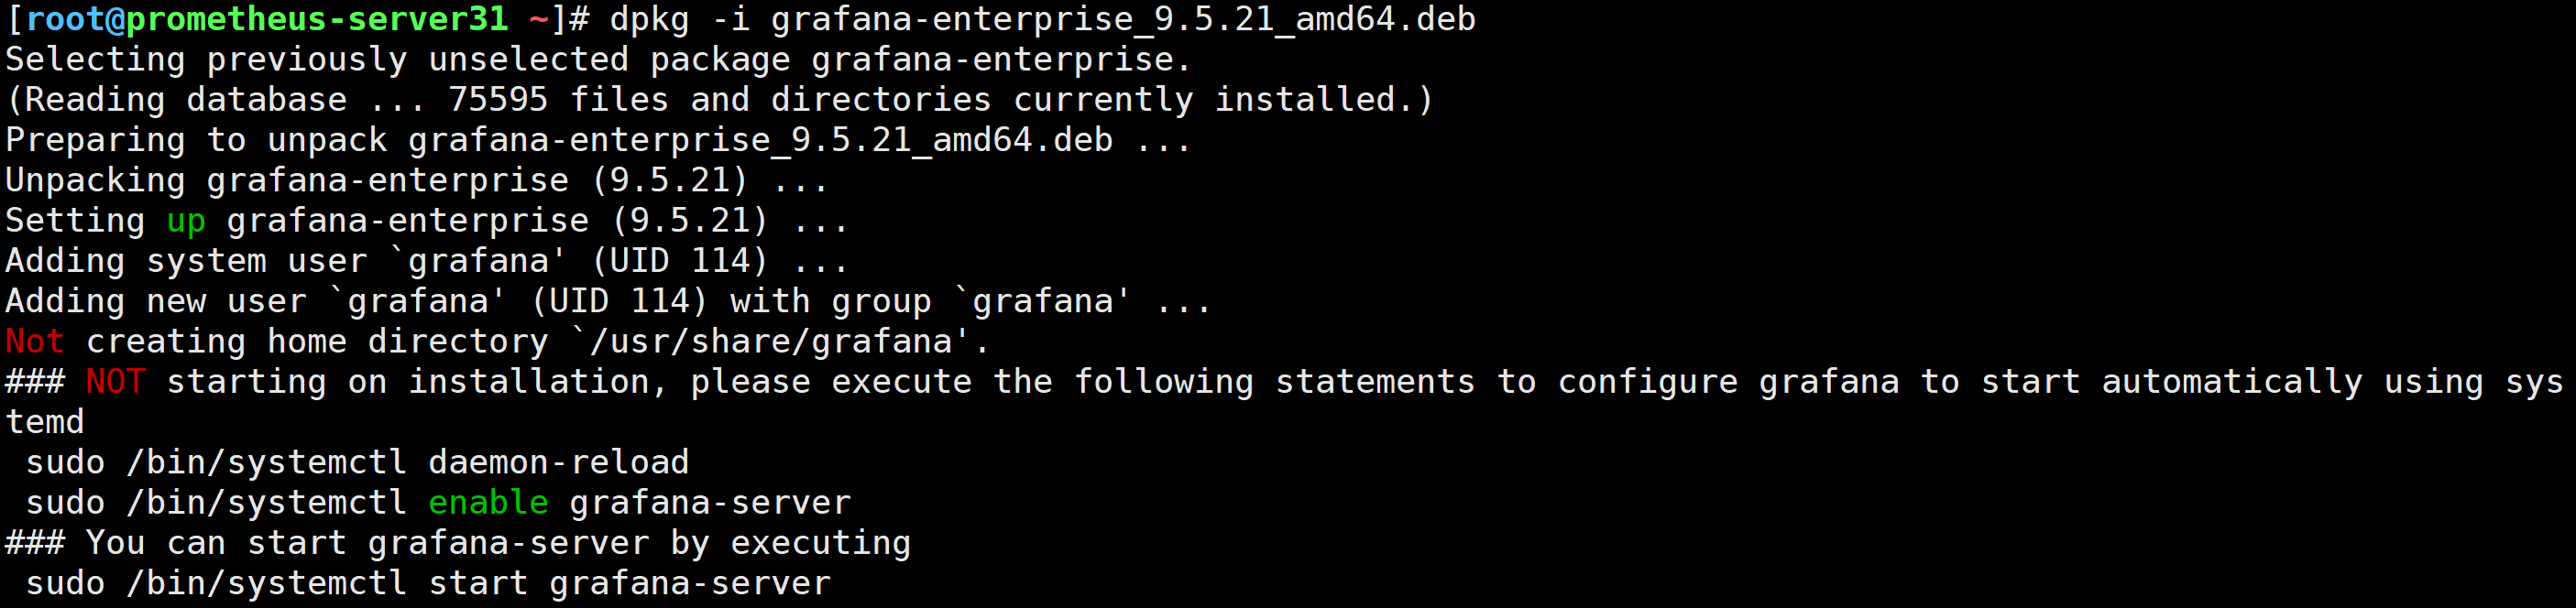
[root@prometheus-server31 ~]# systemctl enable --now grafana-server

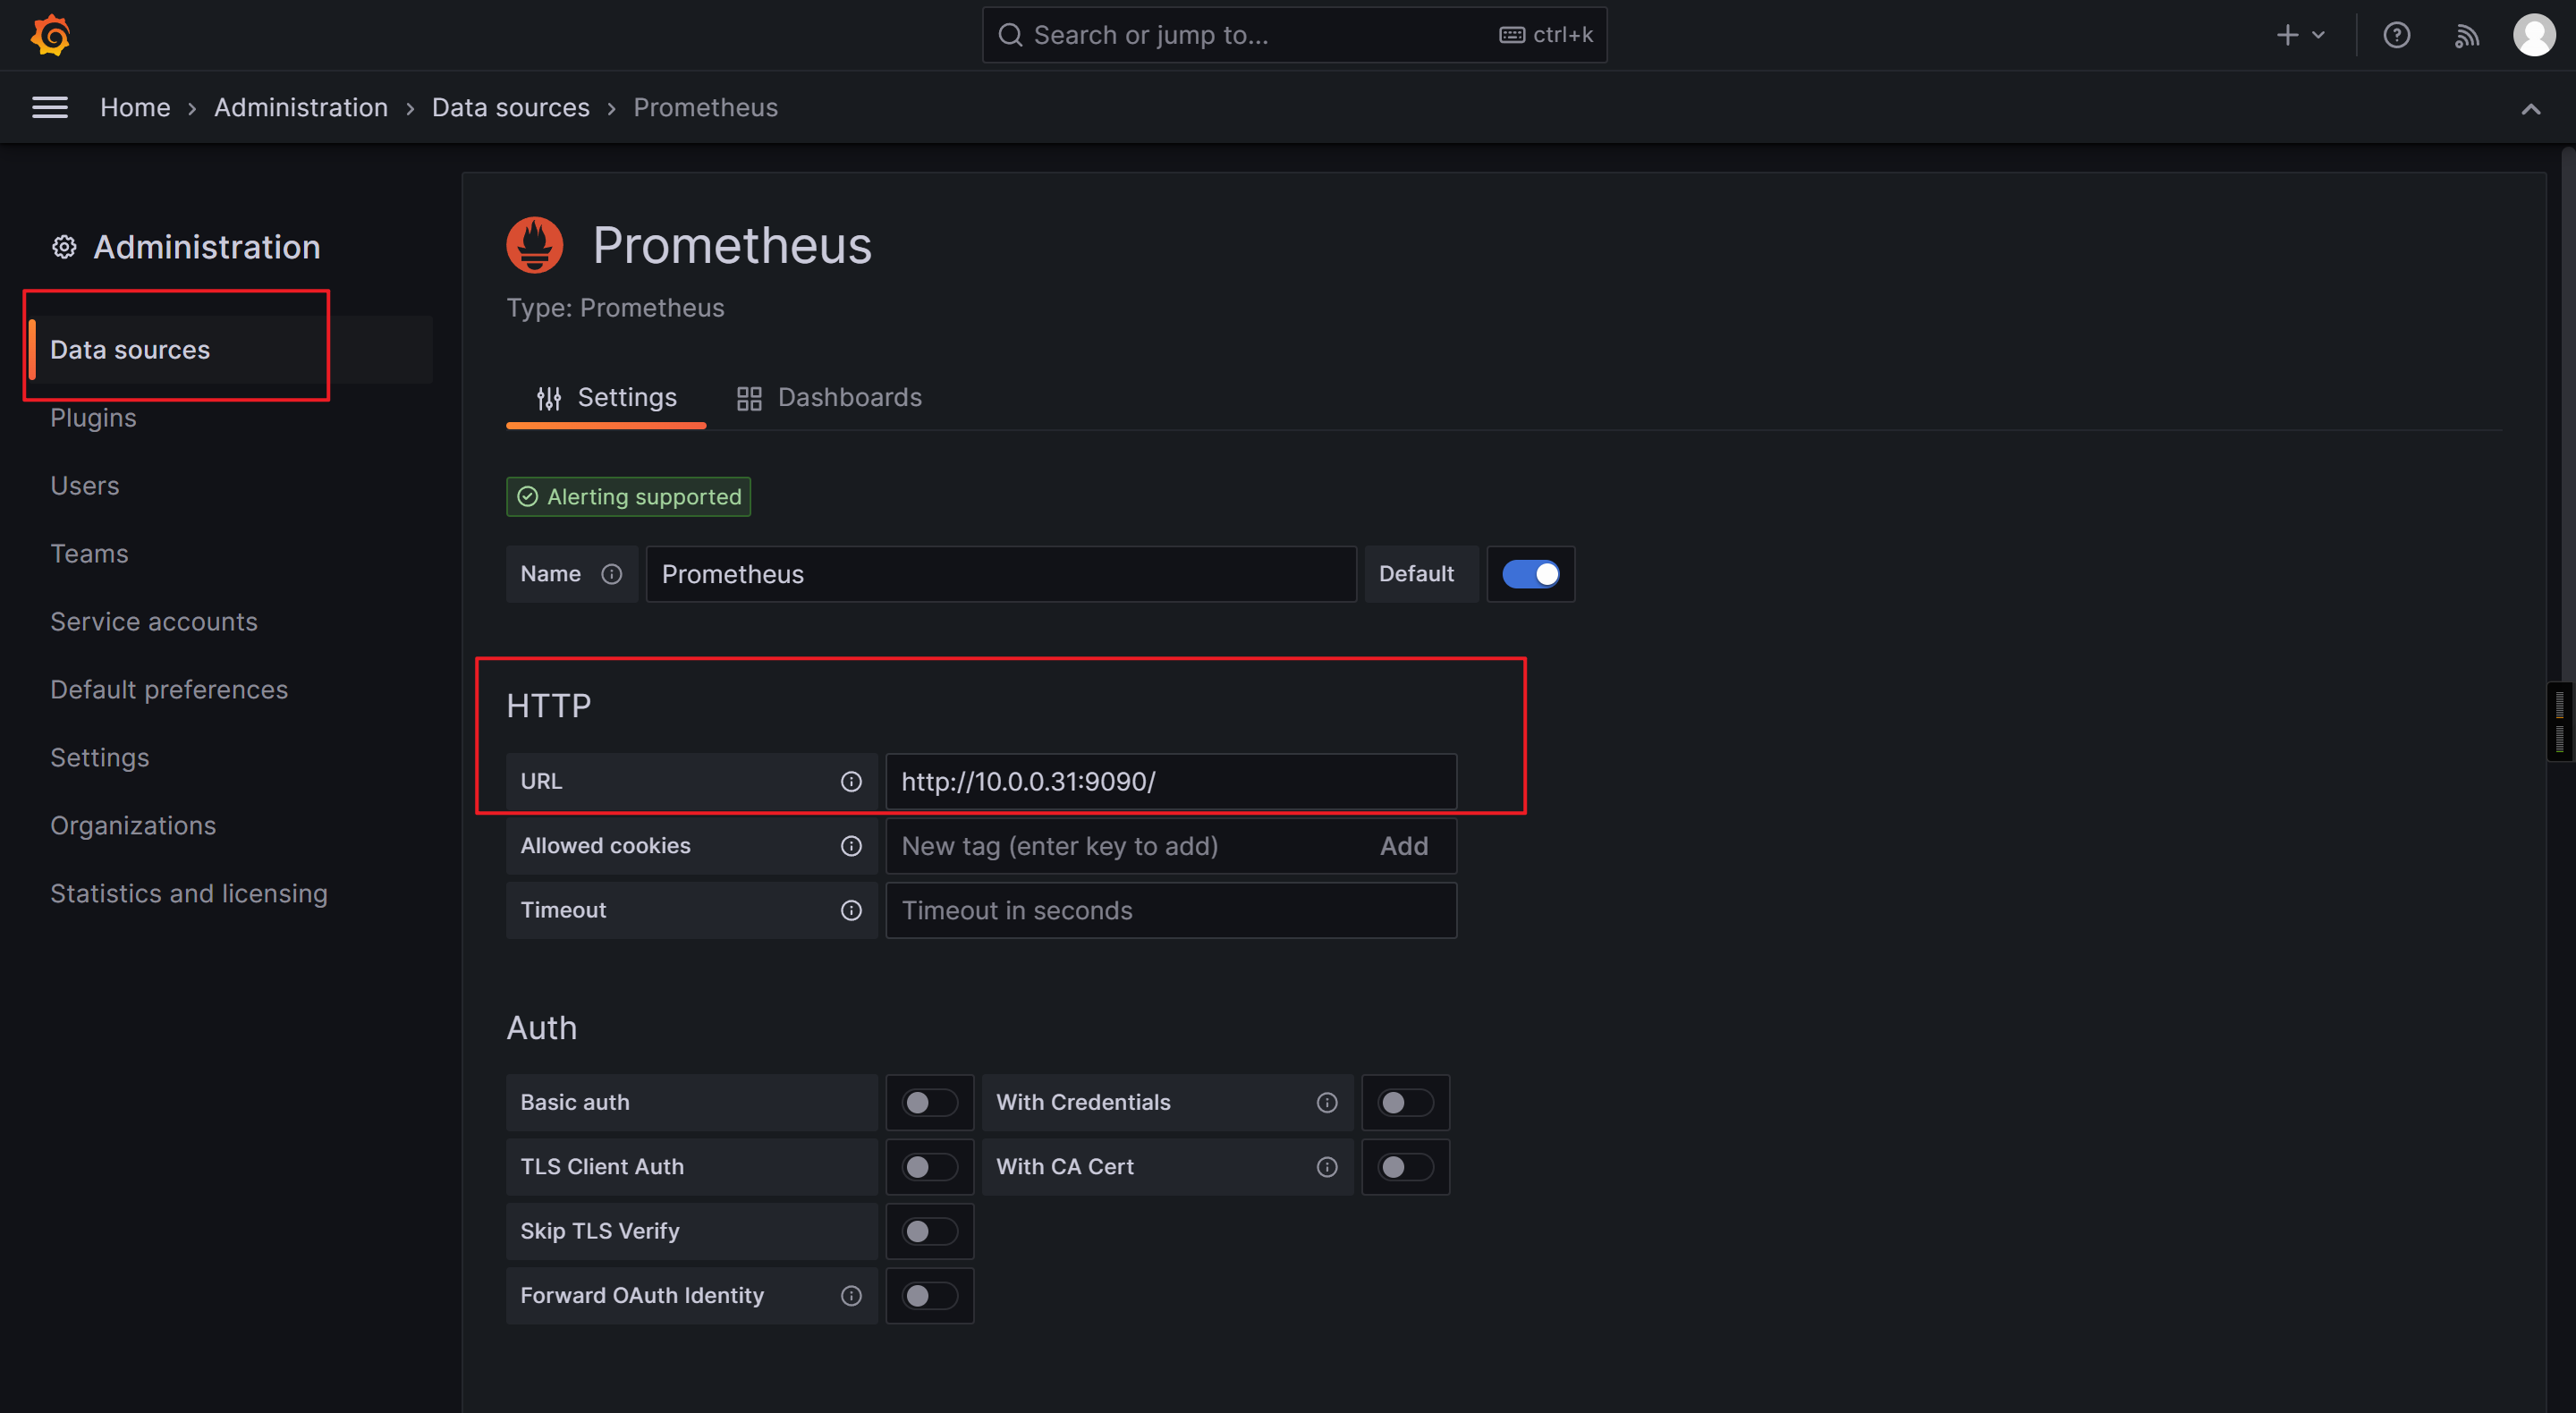
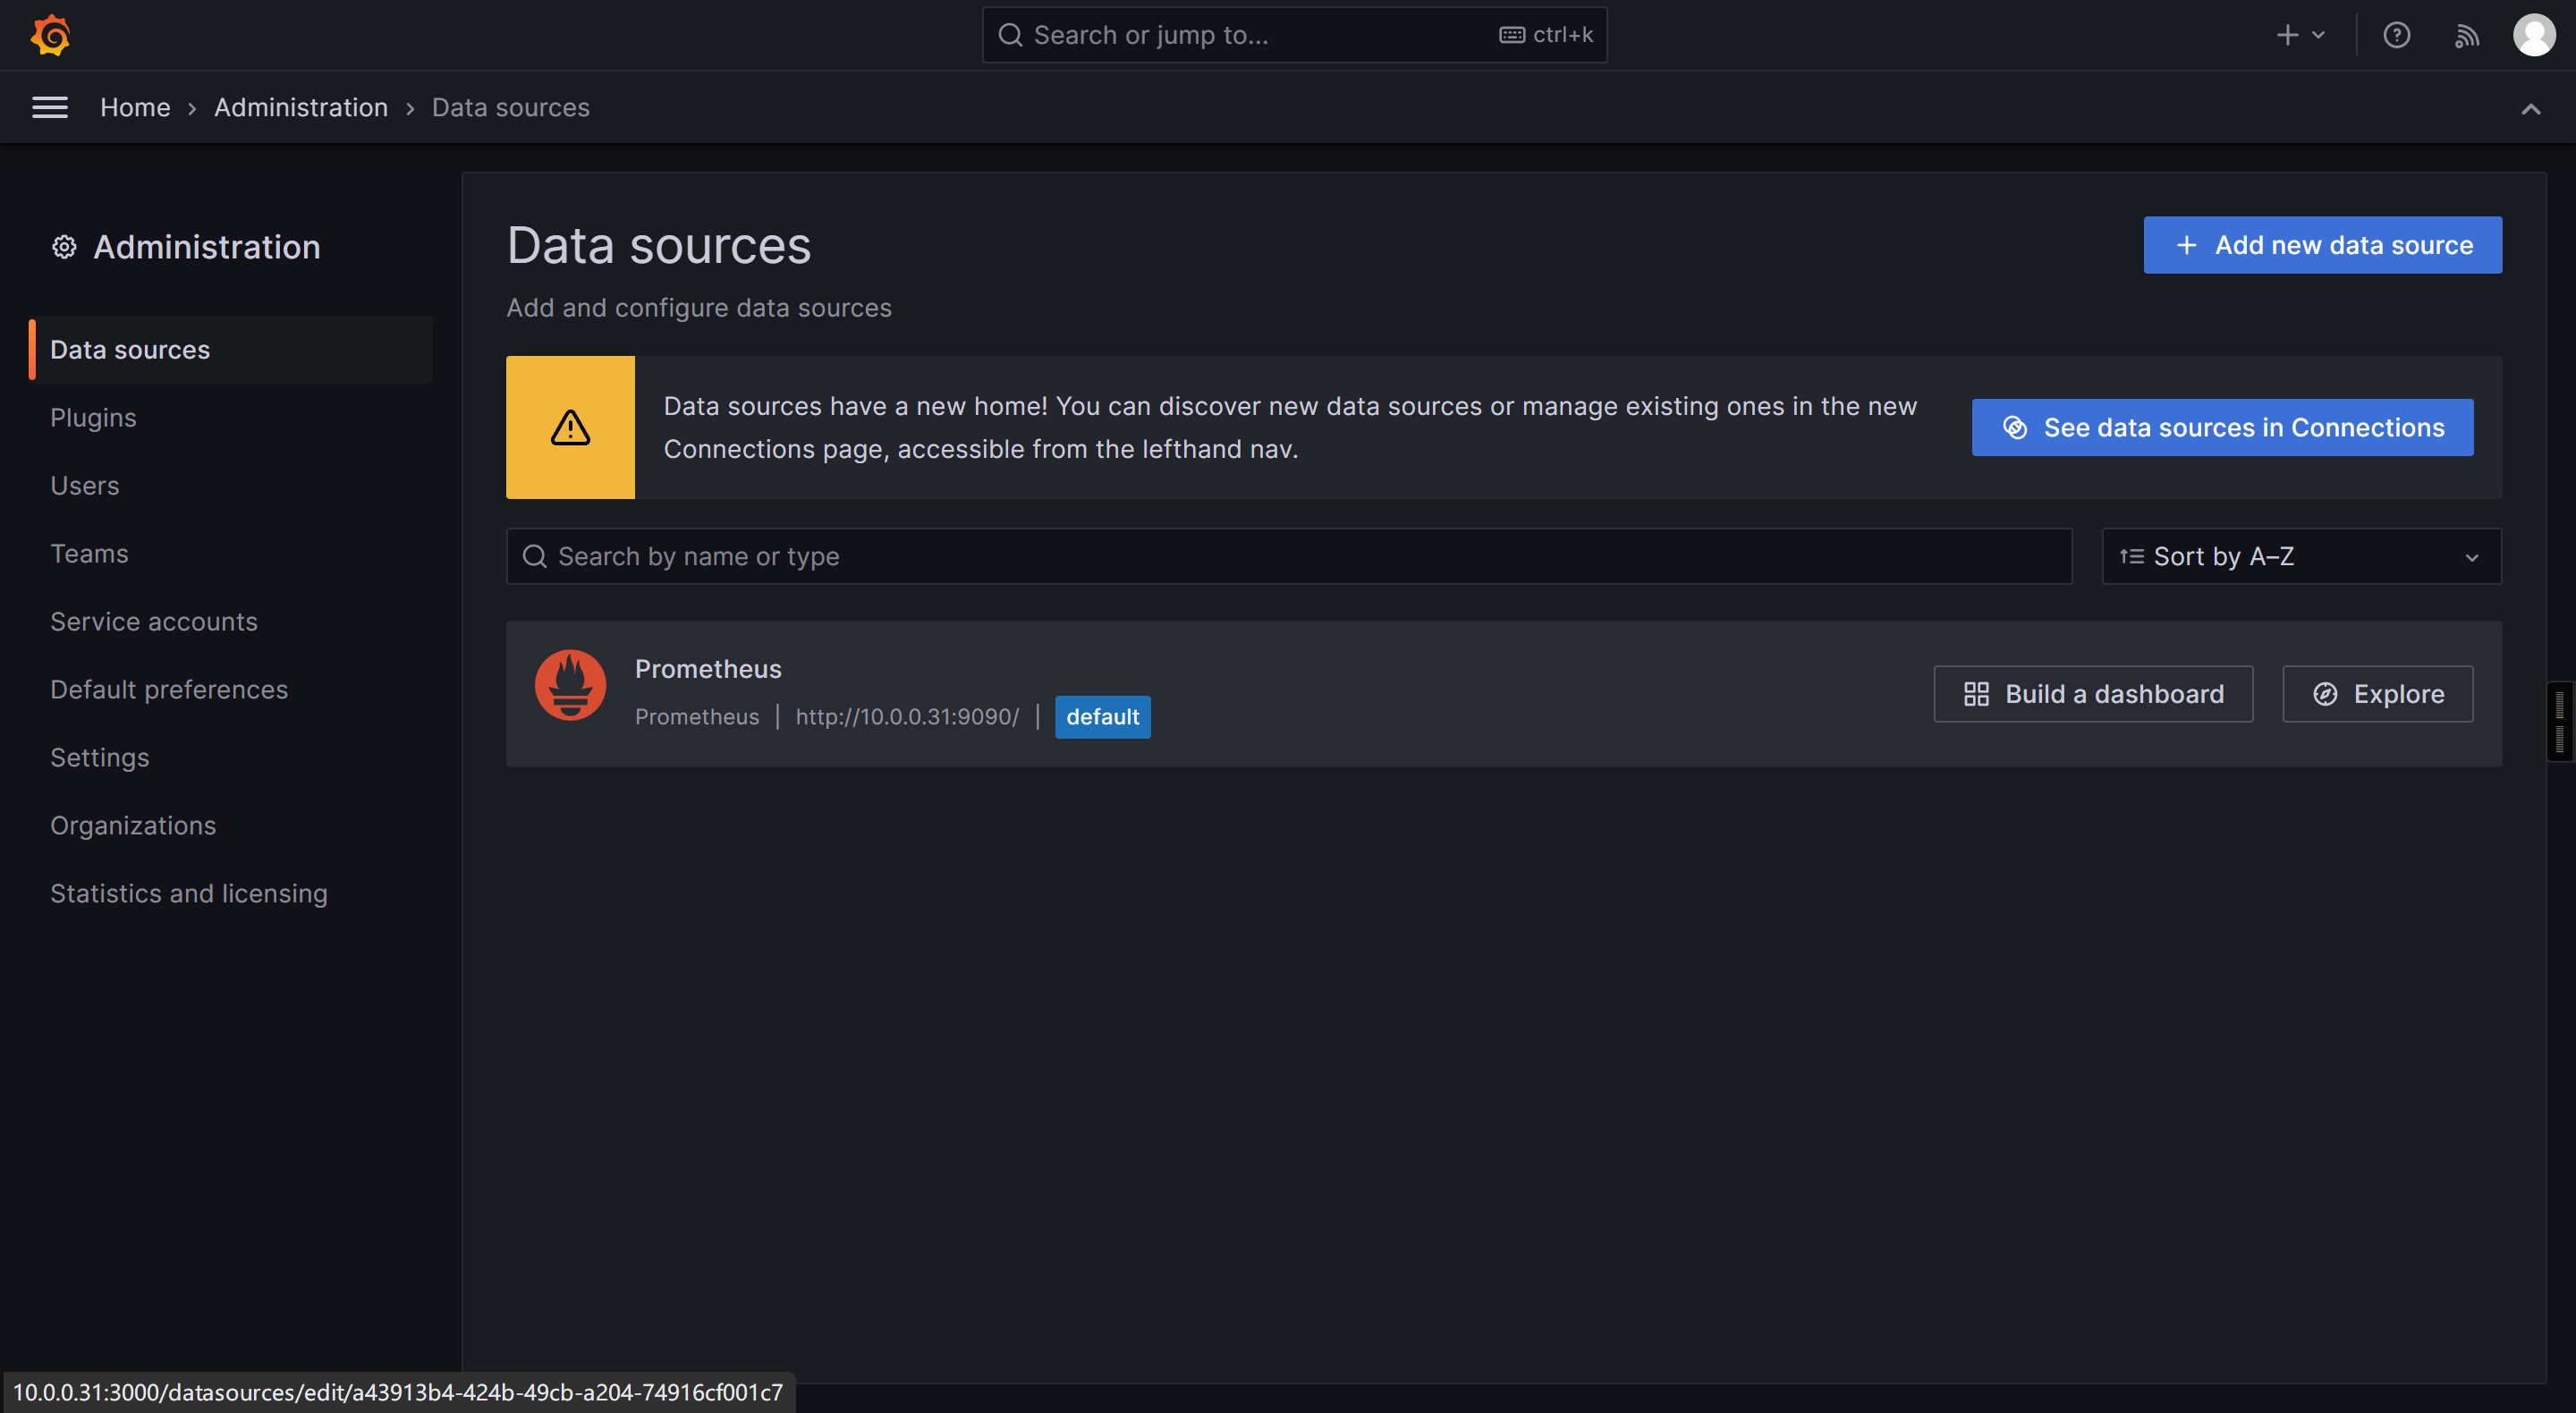
http://10.0.0.31:3000/
默认的用户名和密码均为: admin
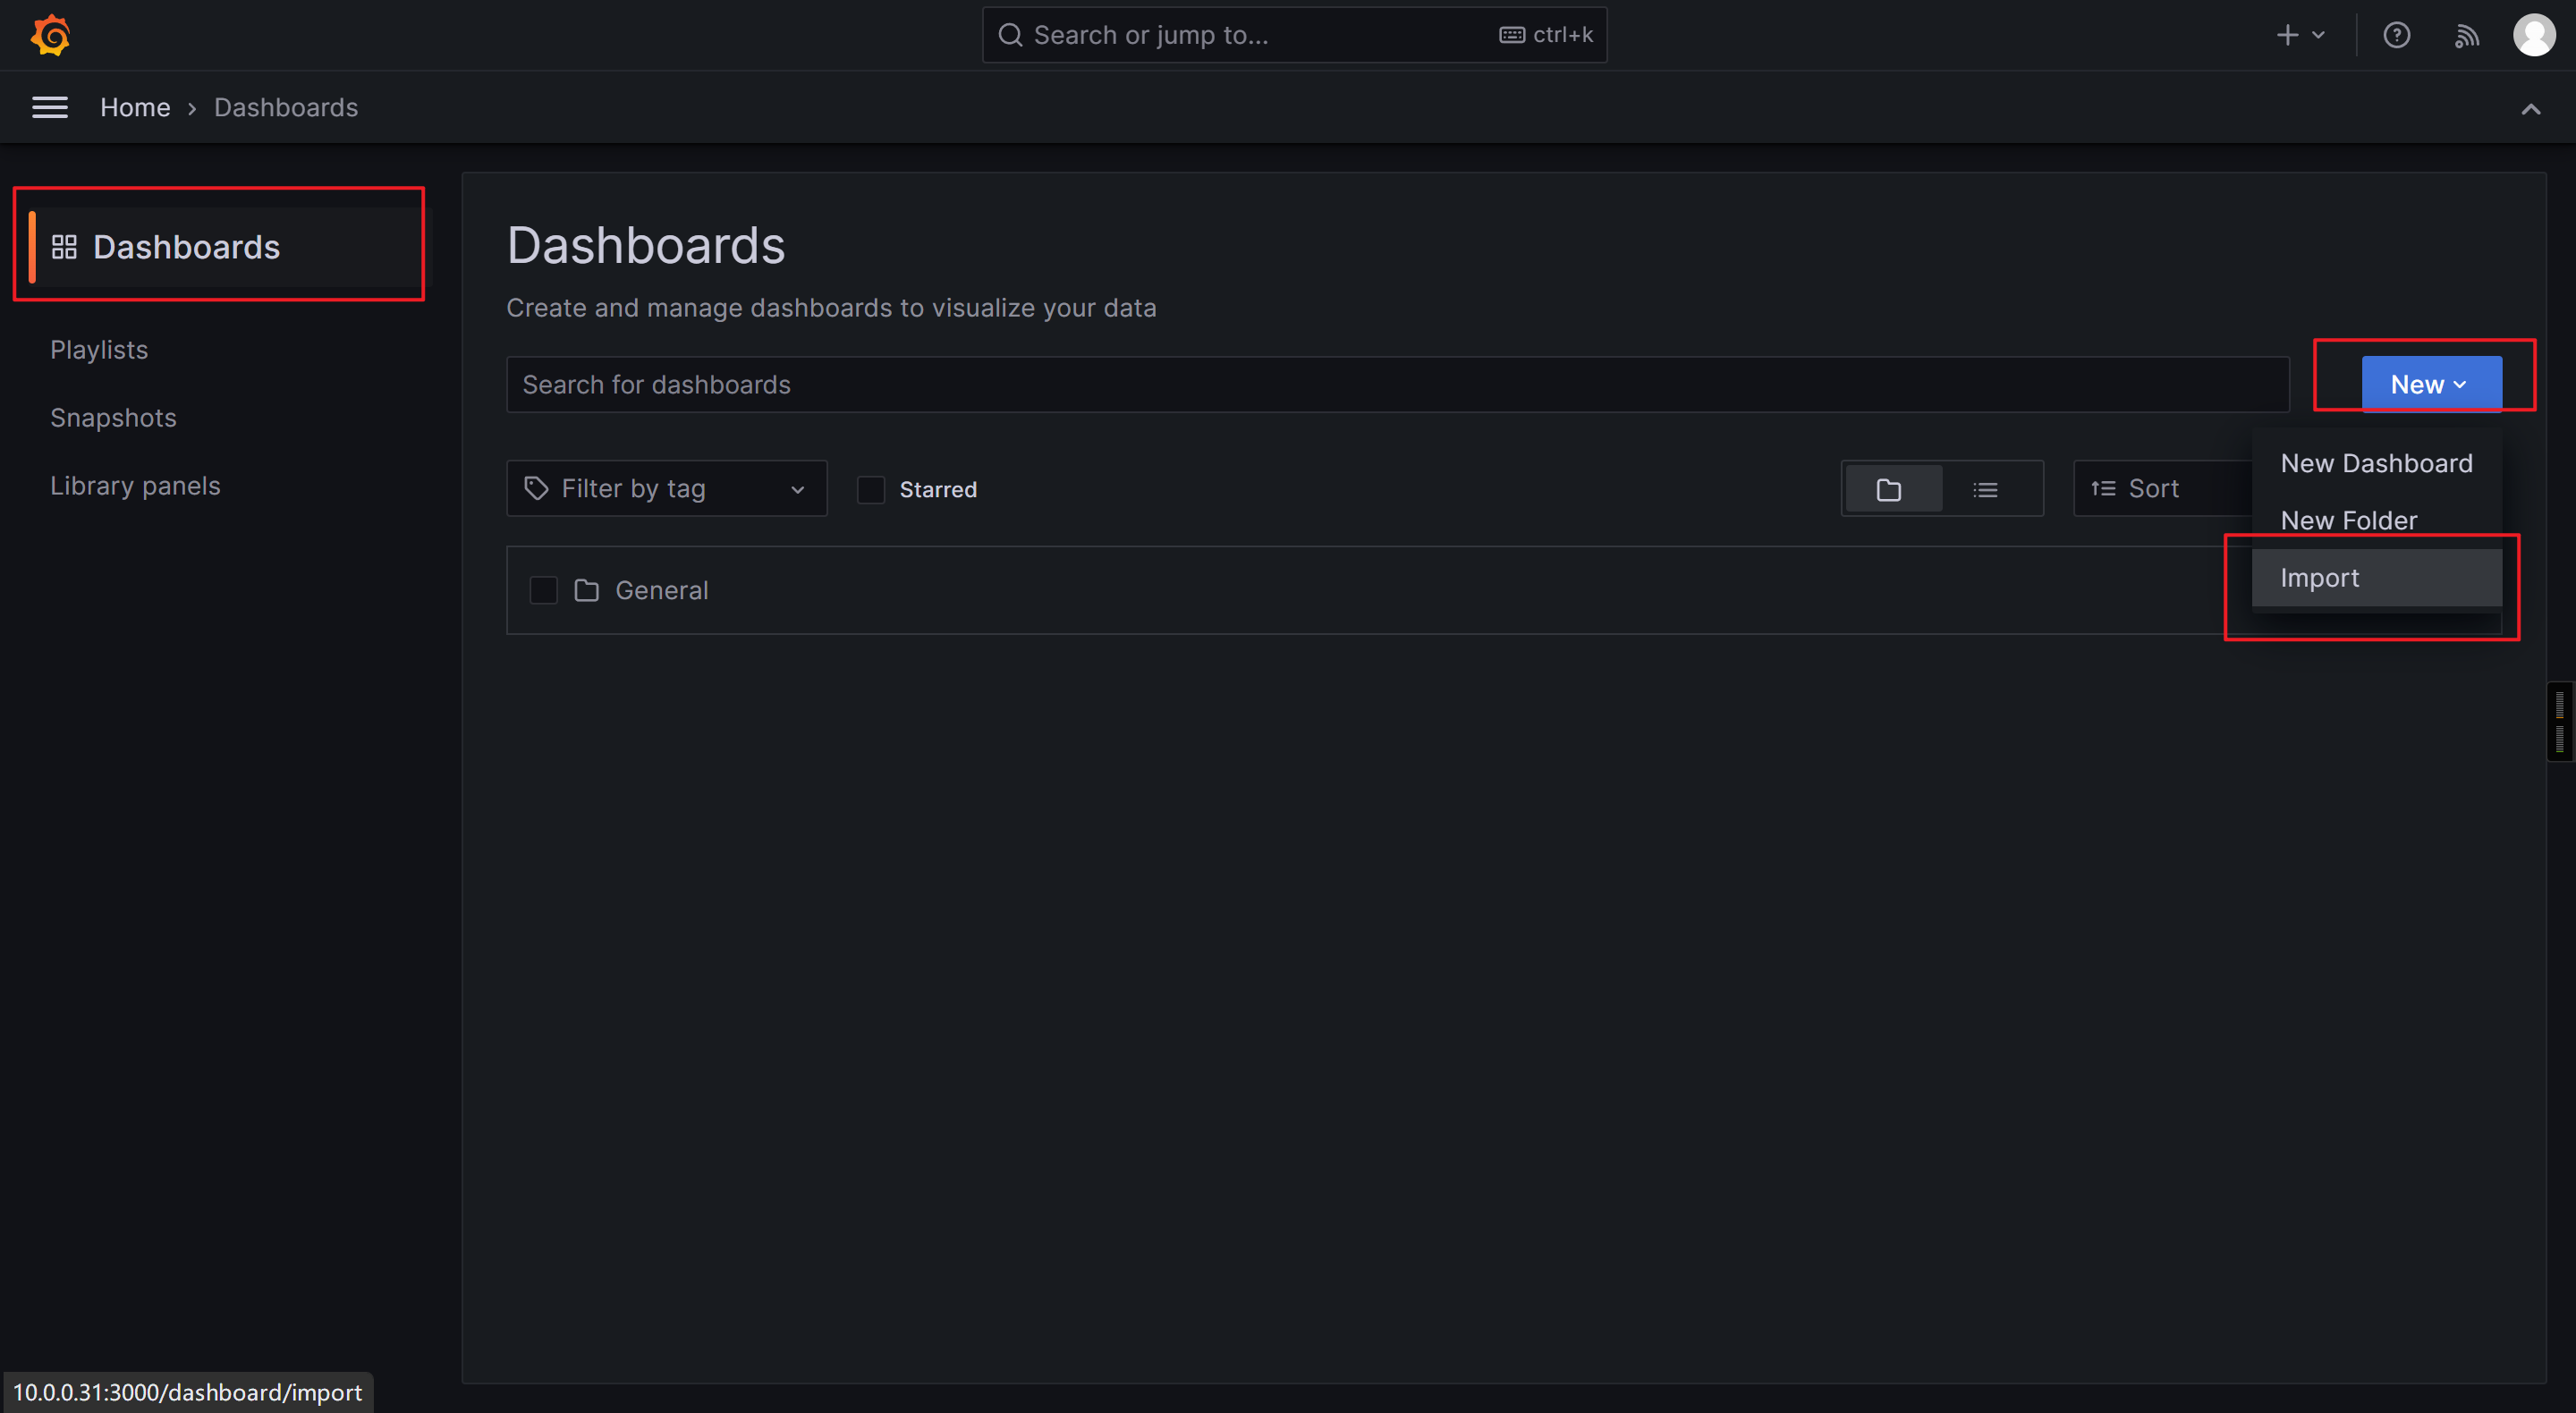
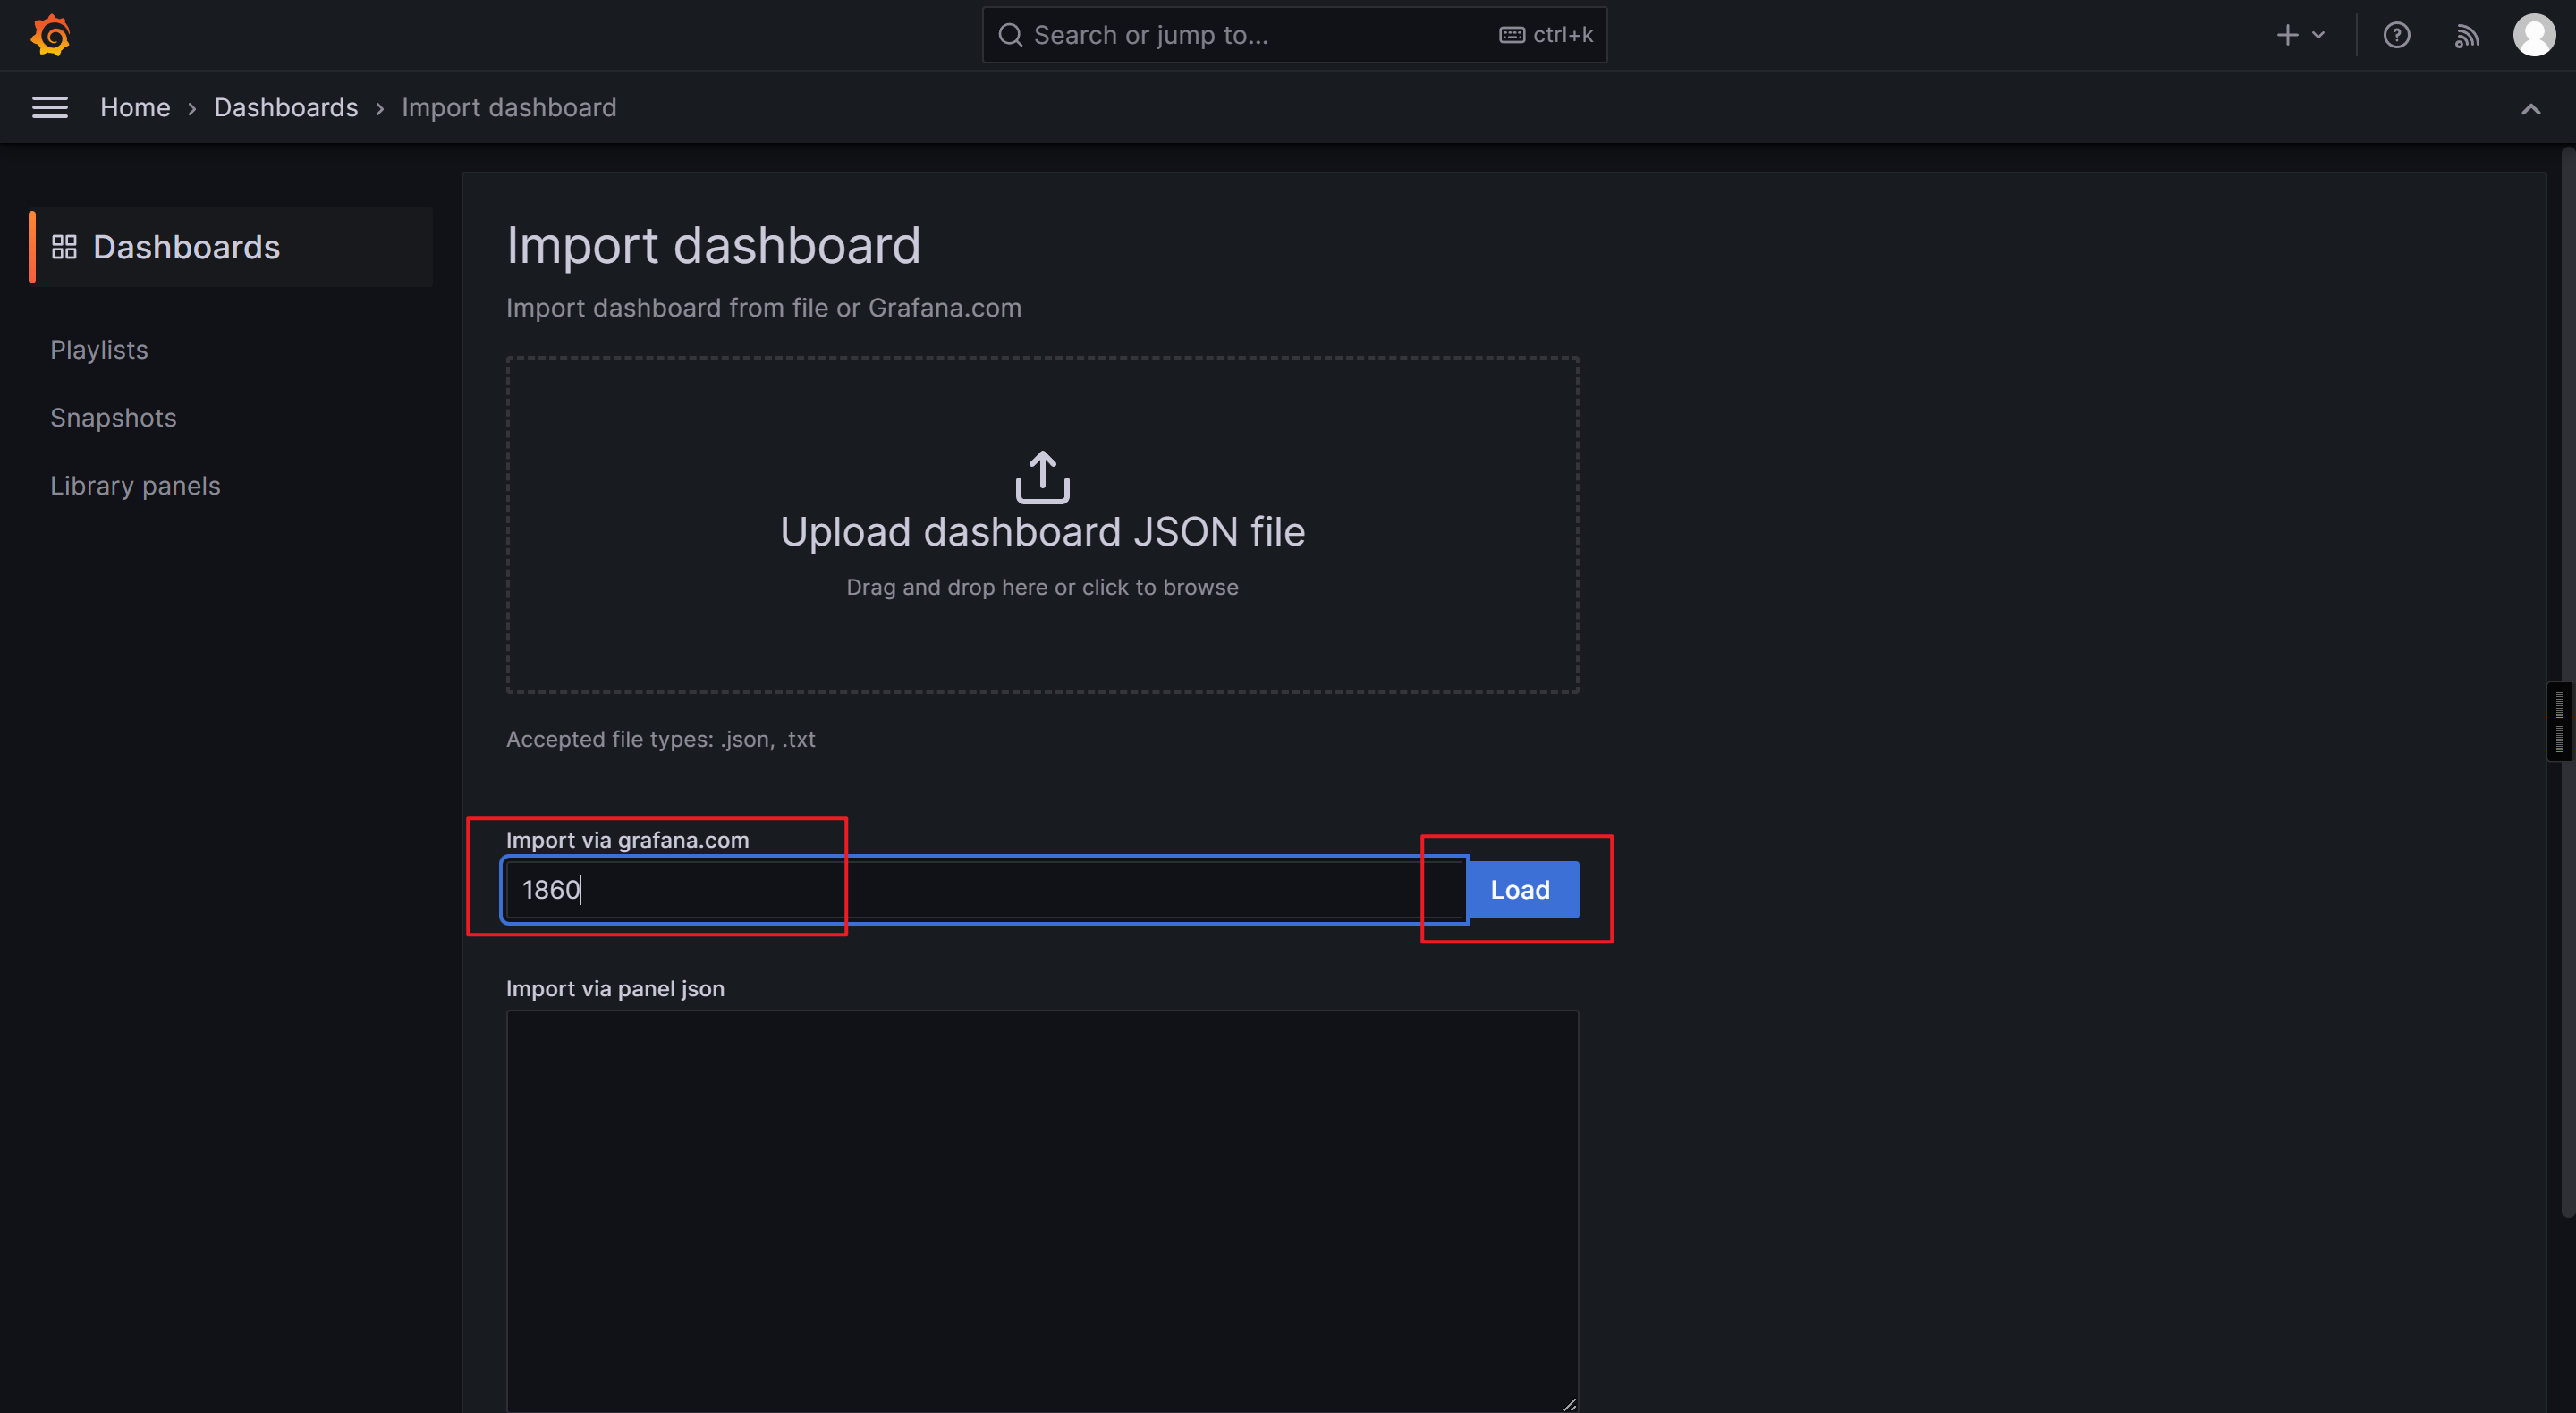
查询模板ID站点:
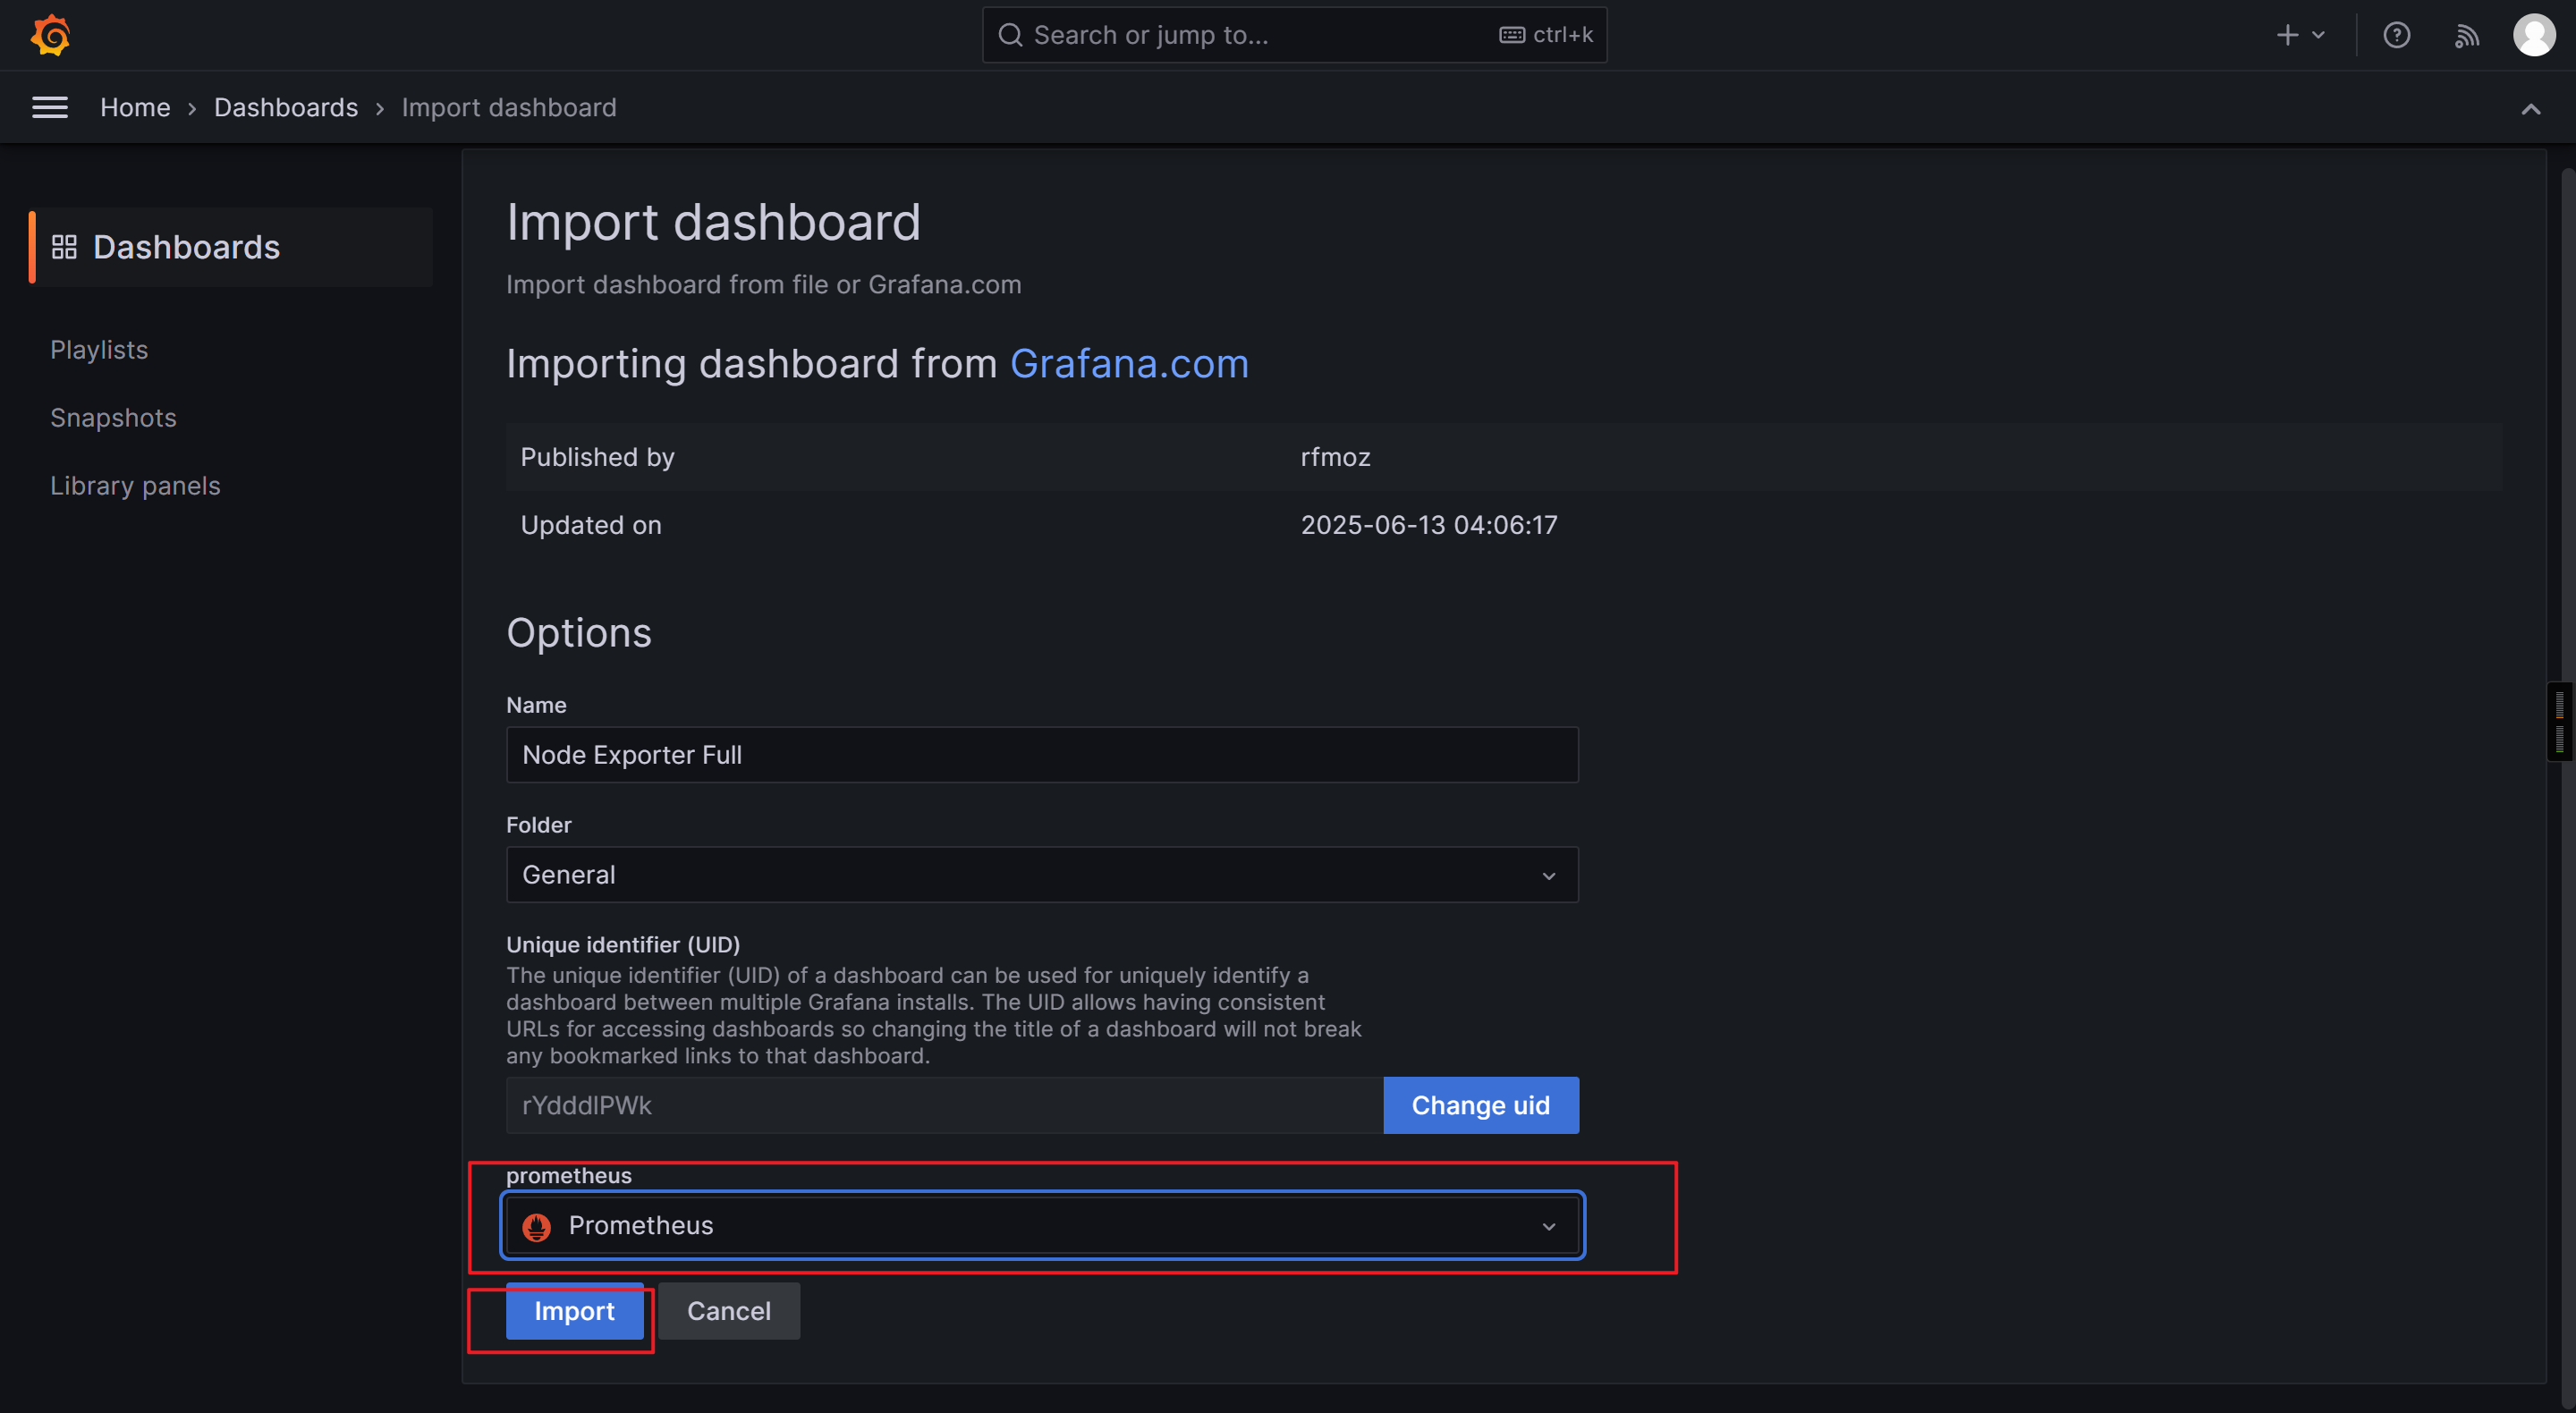
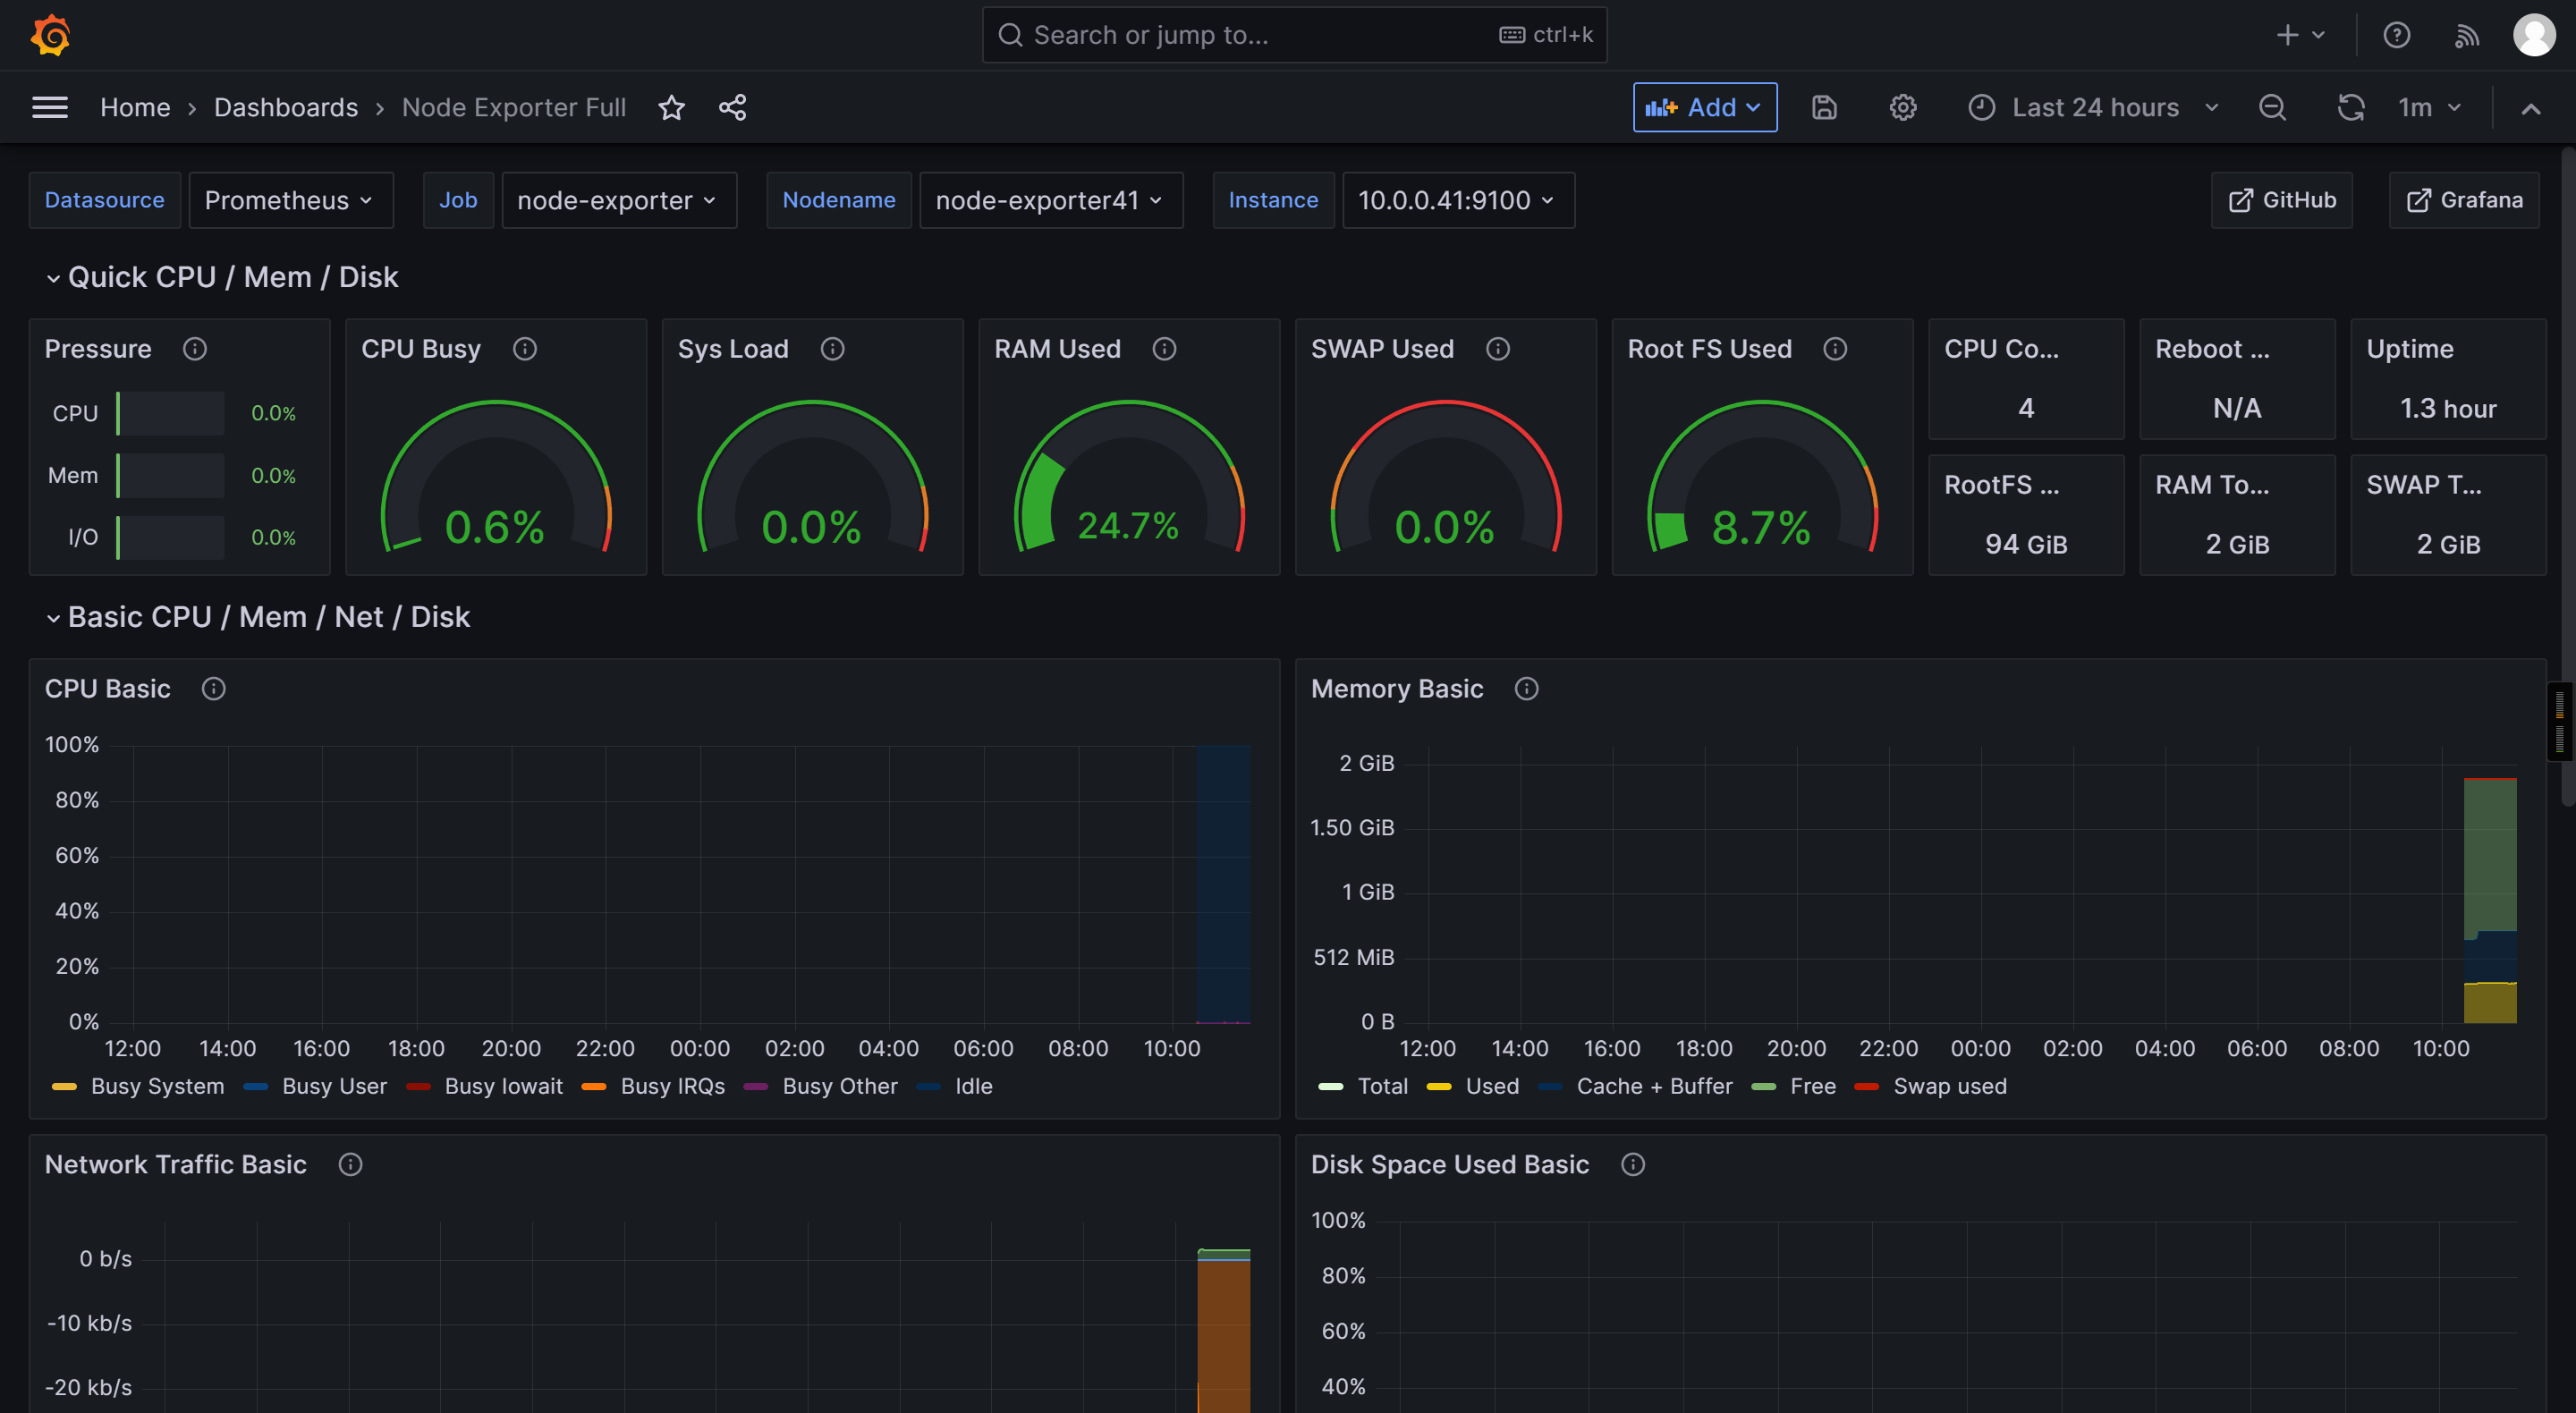
参考链接:
https://prometheus.io/docs/instrumenting/exporters/#hardware-related
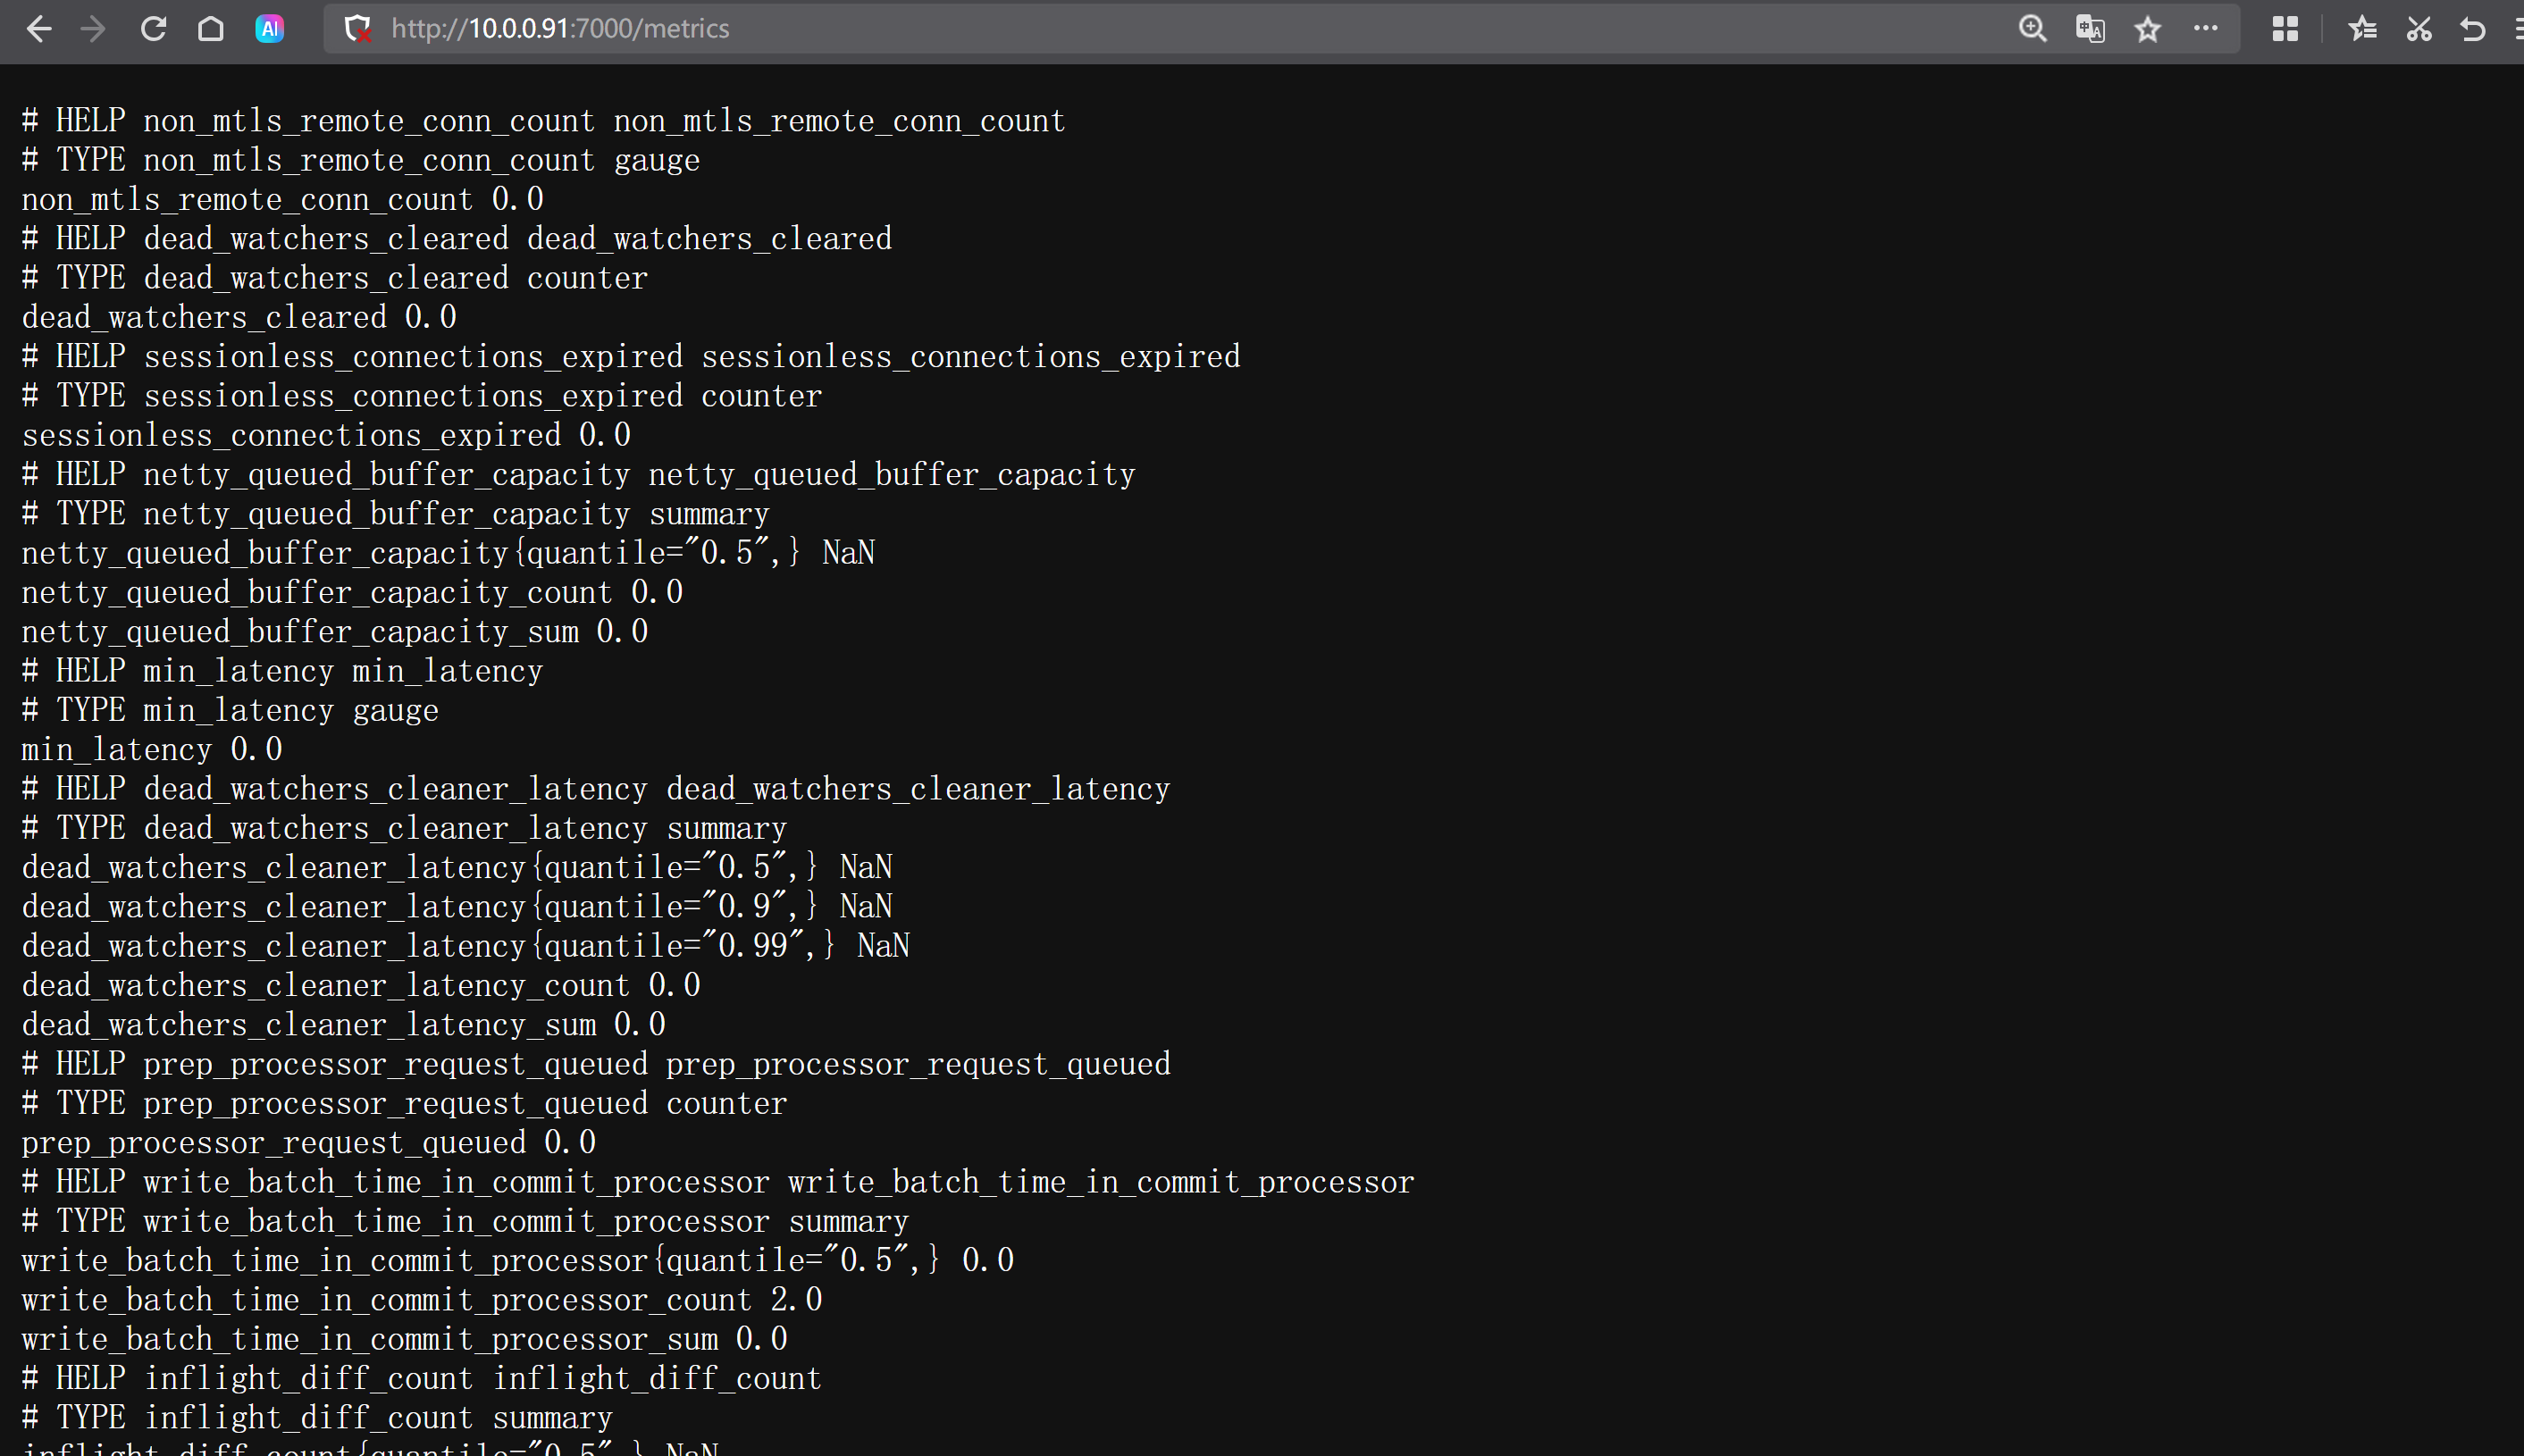
被监控端需要暴露metrics指标
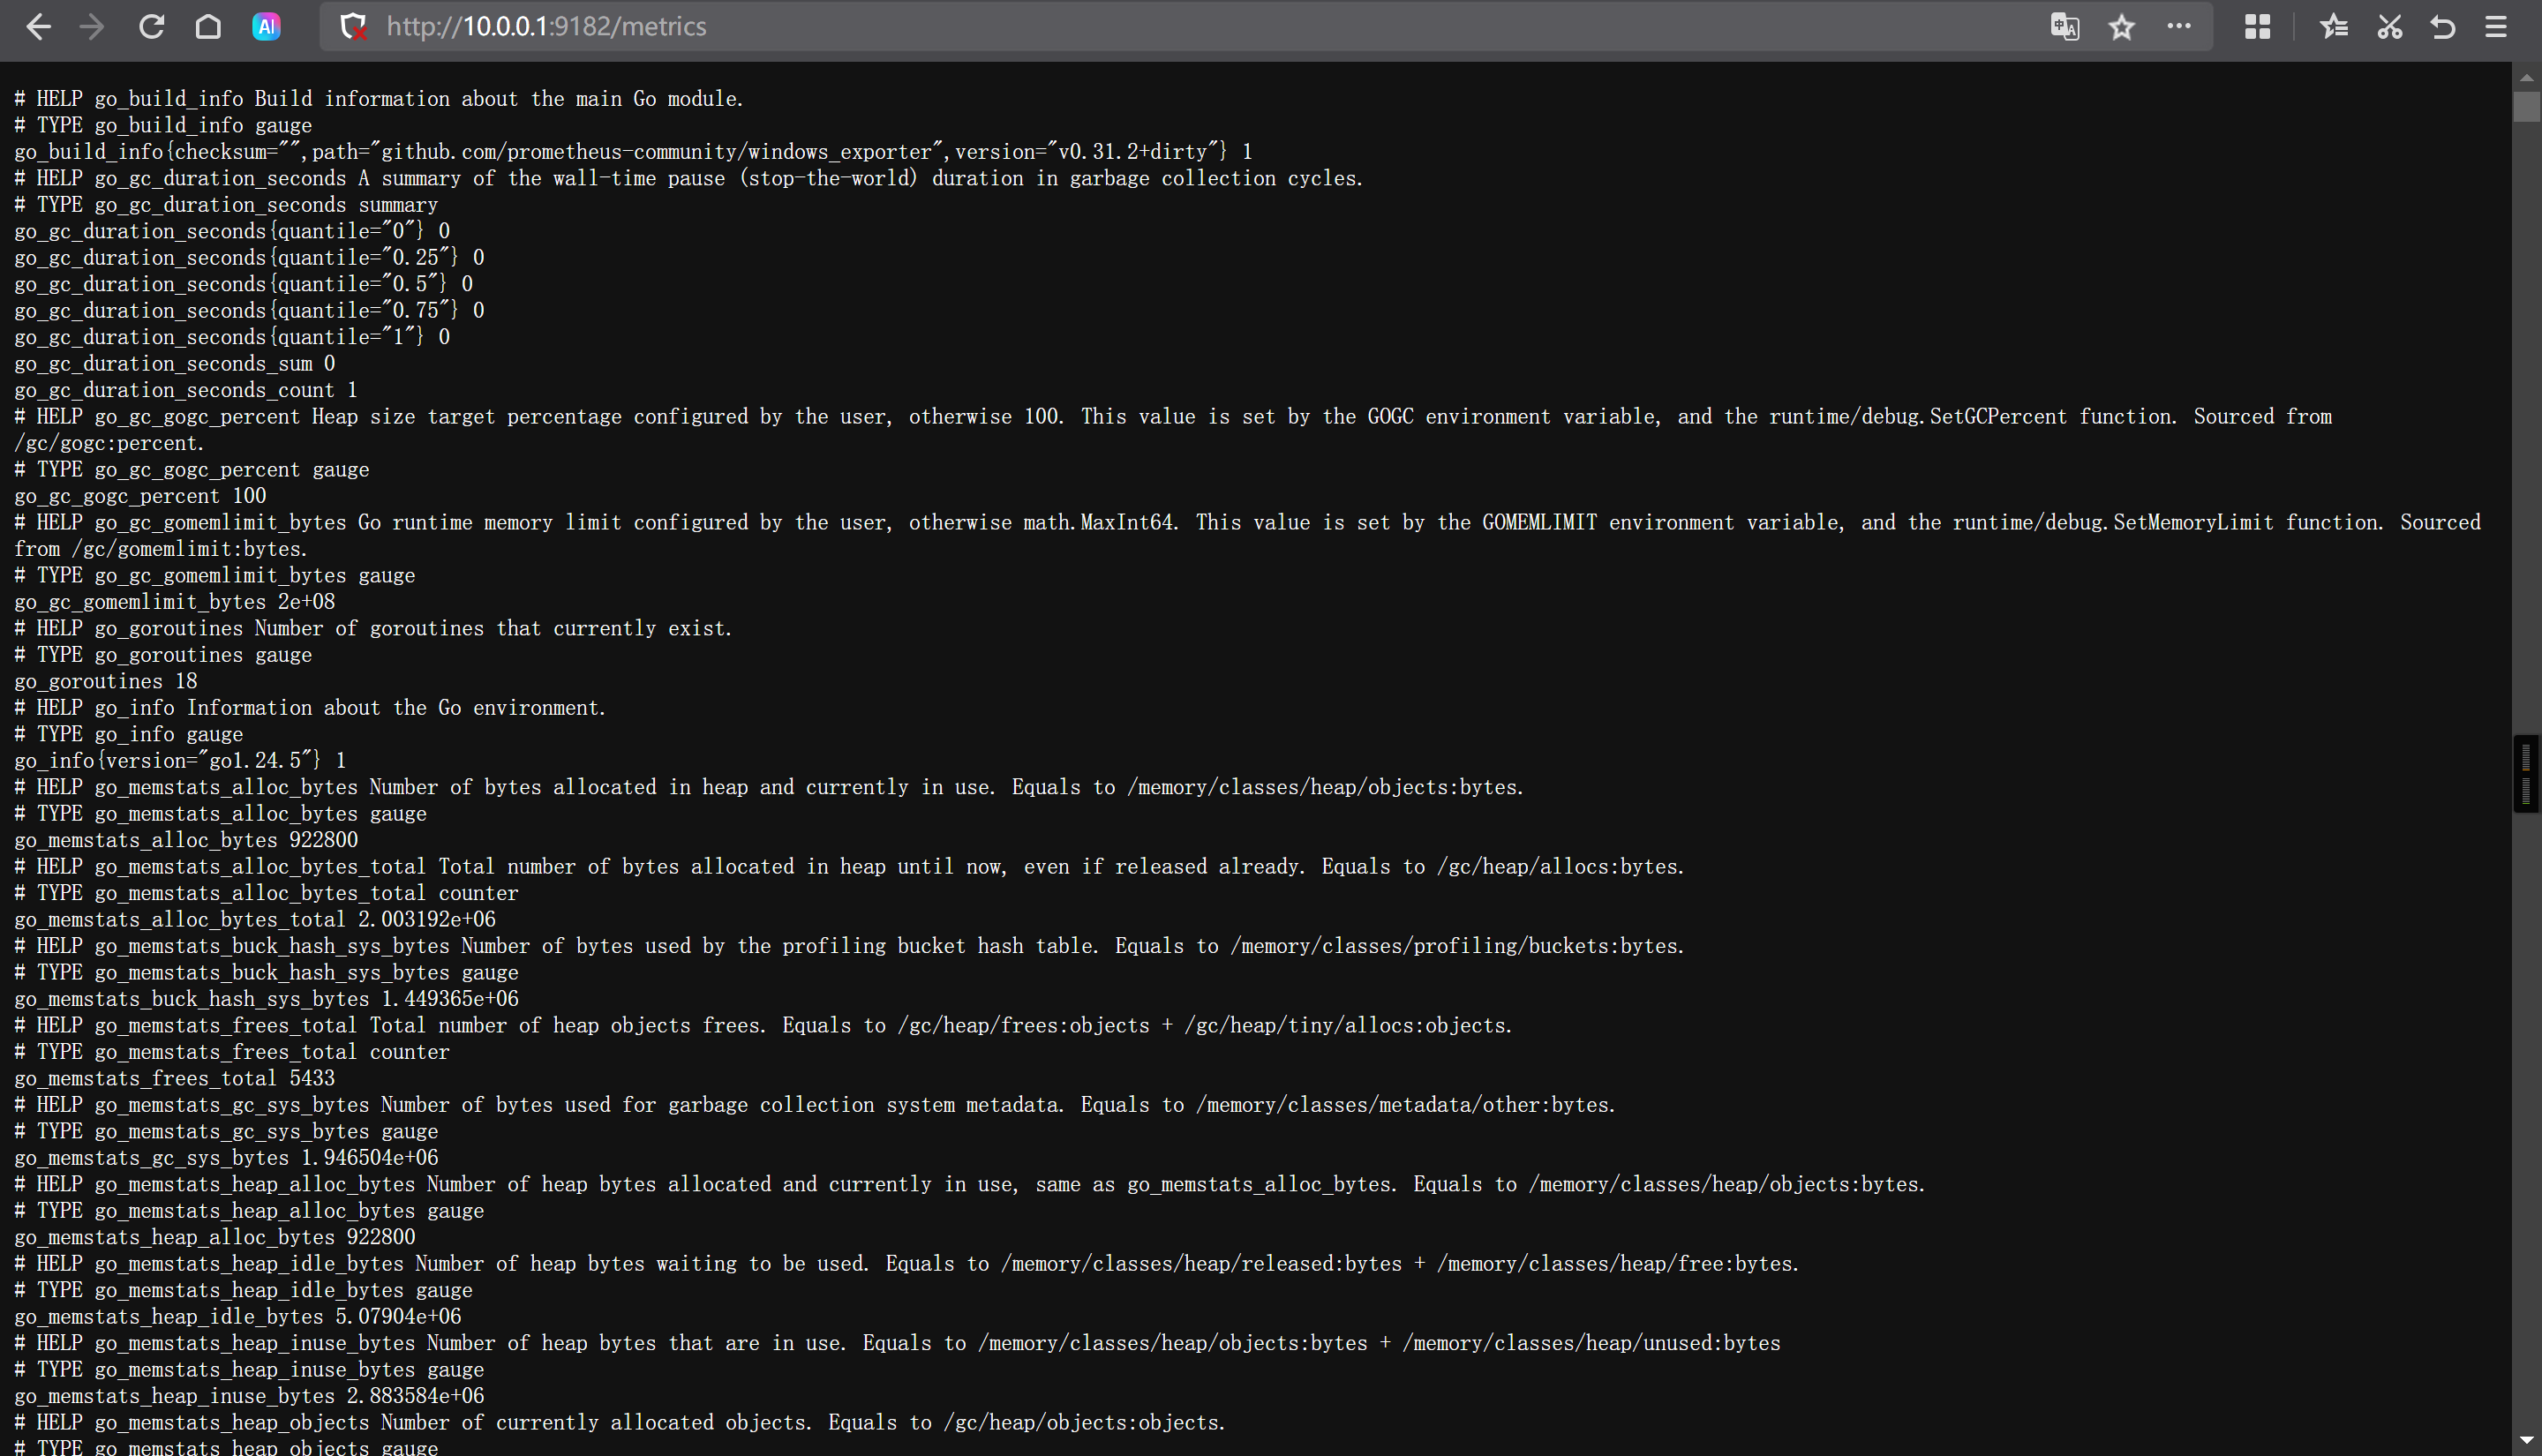
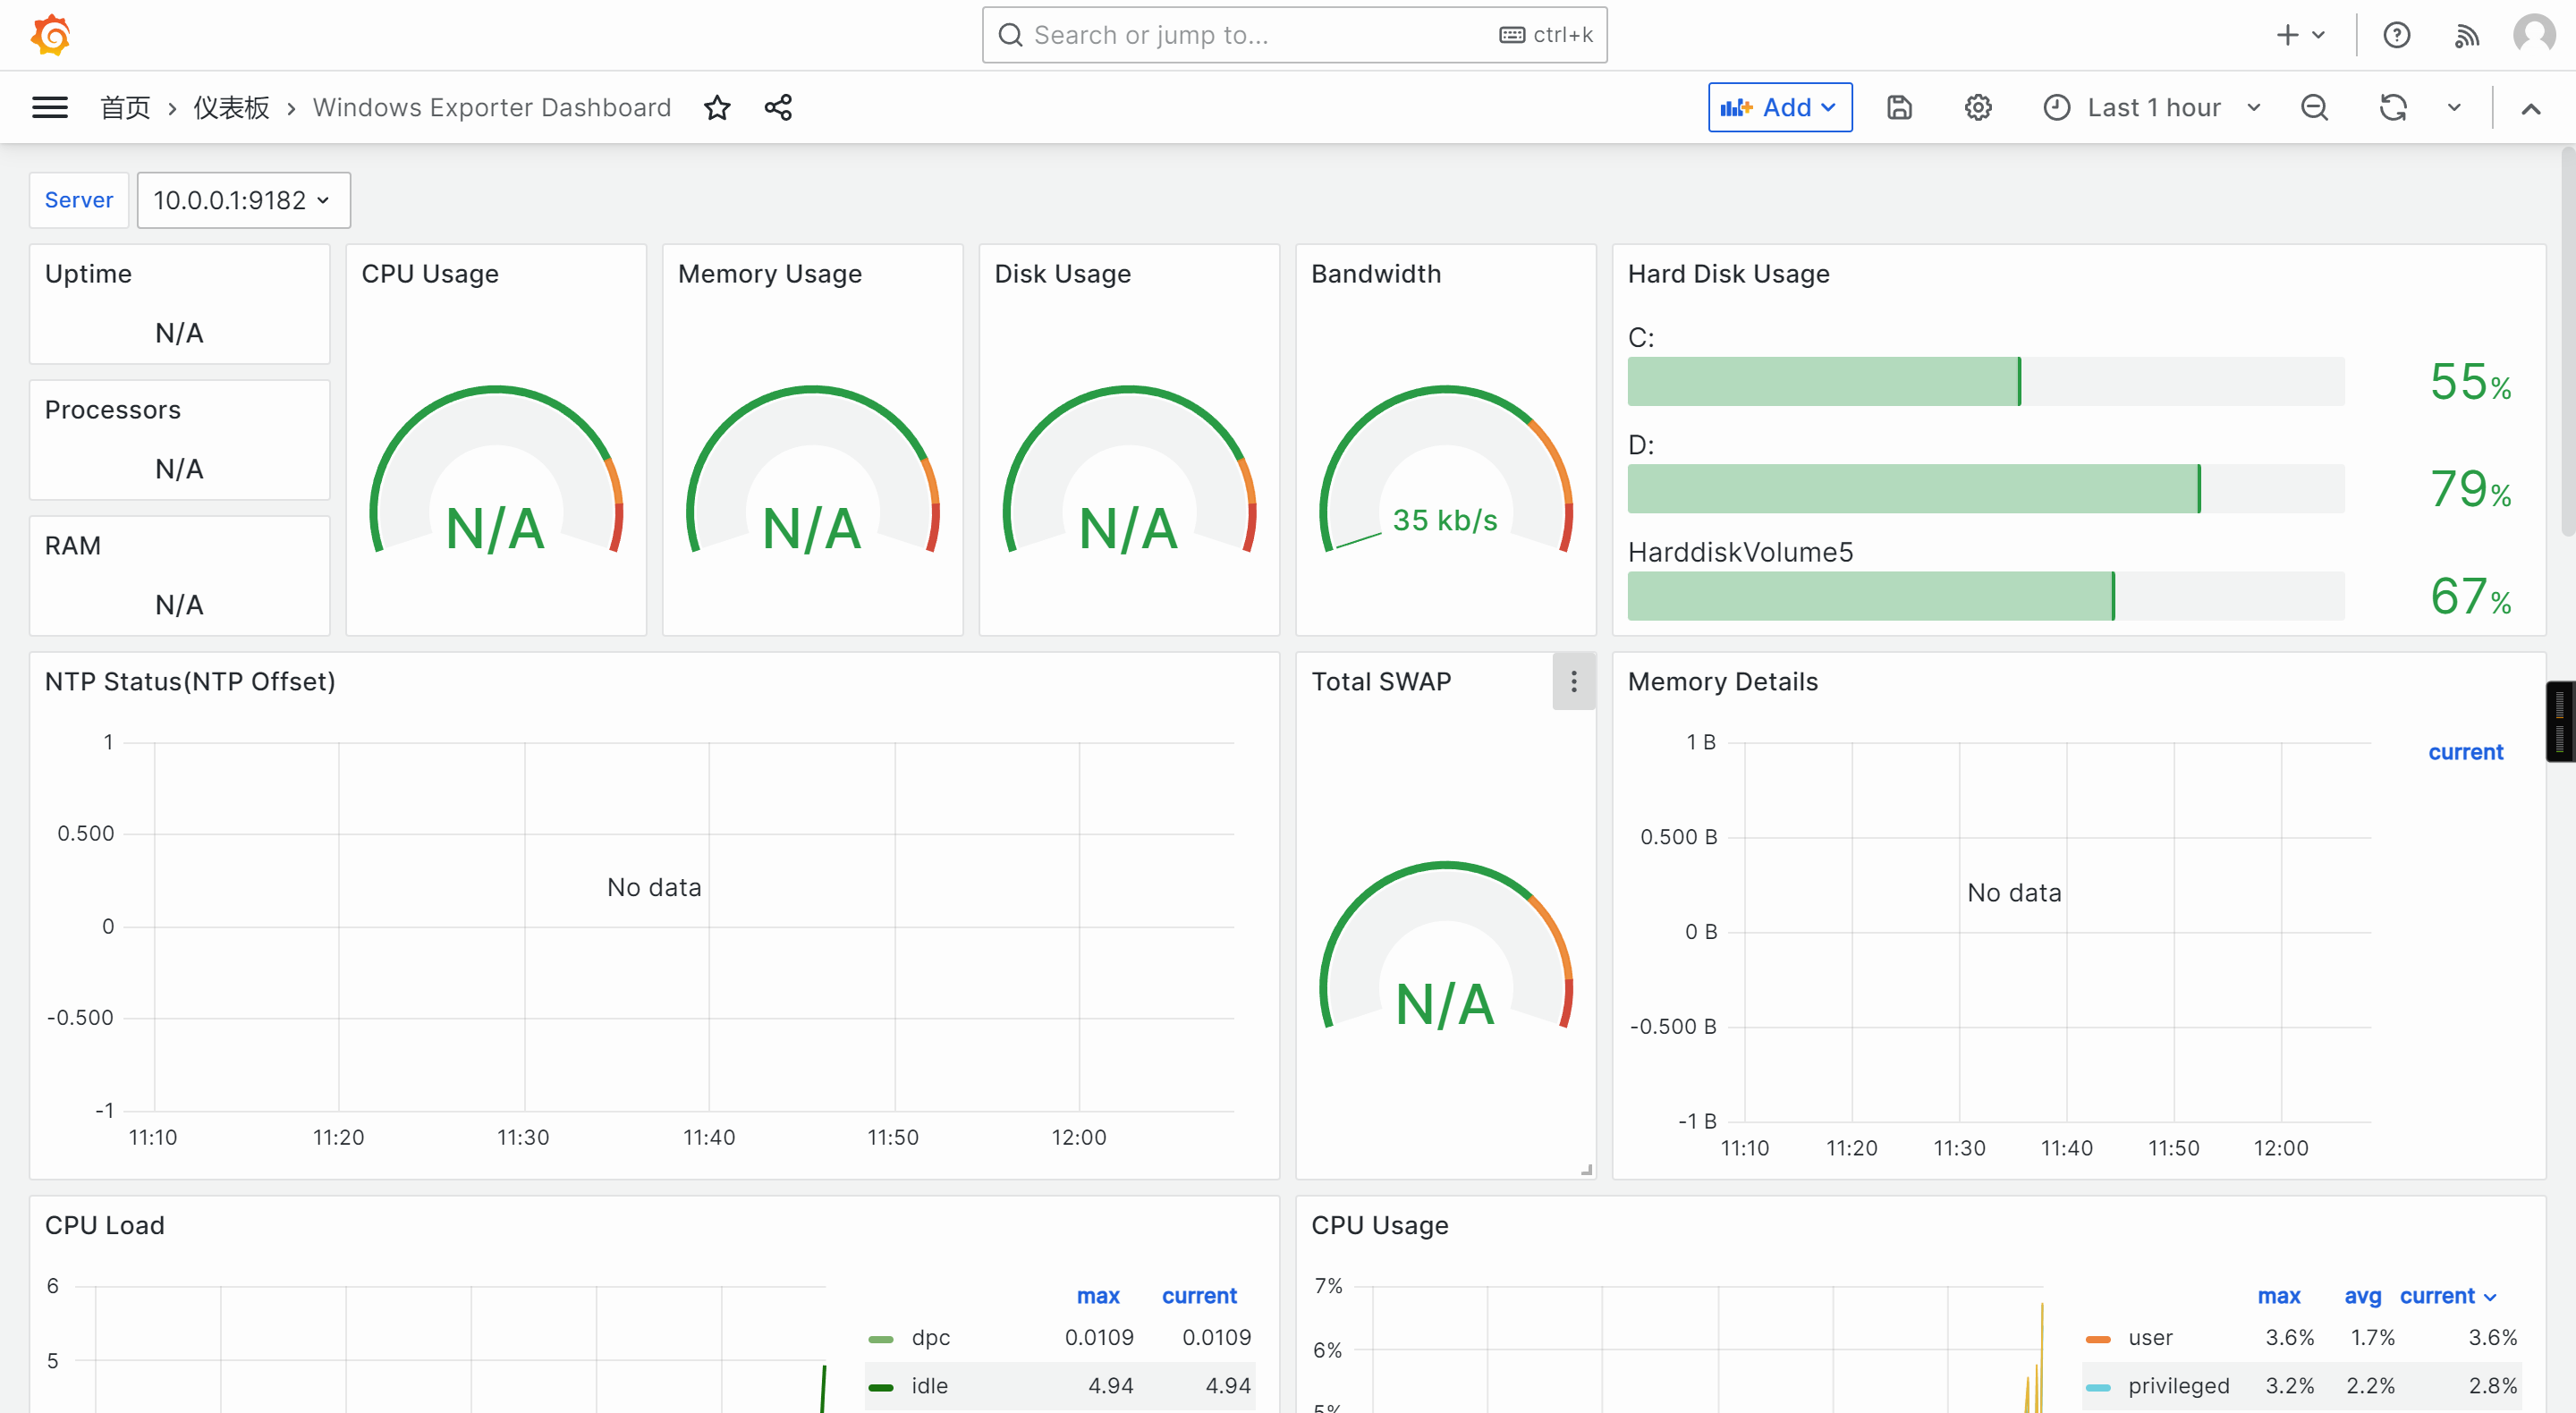
windows_exporter-0.31.2-amd64.exe
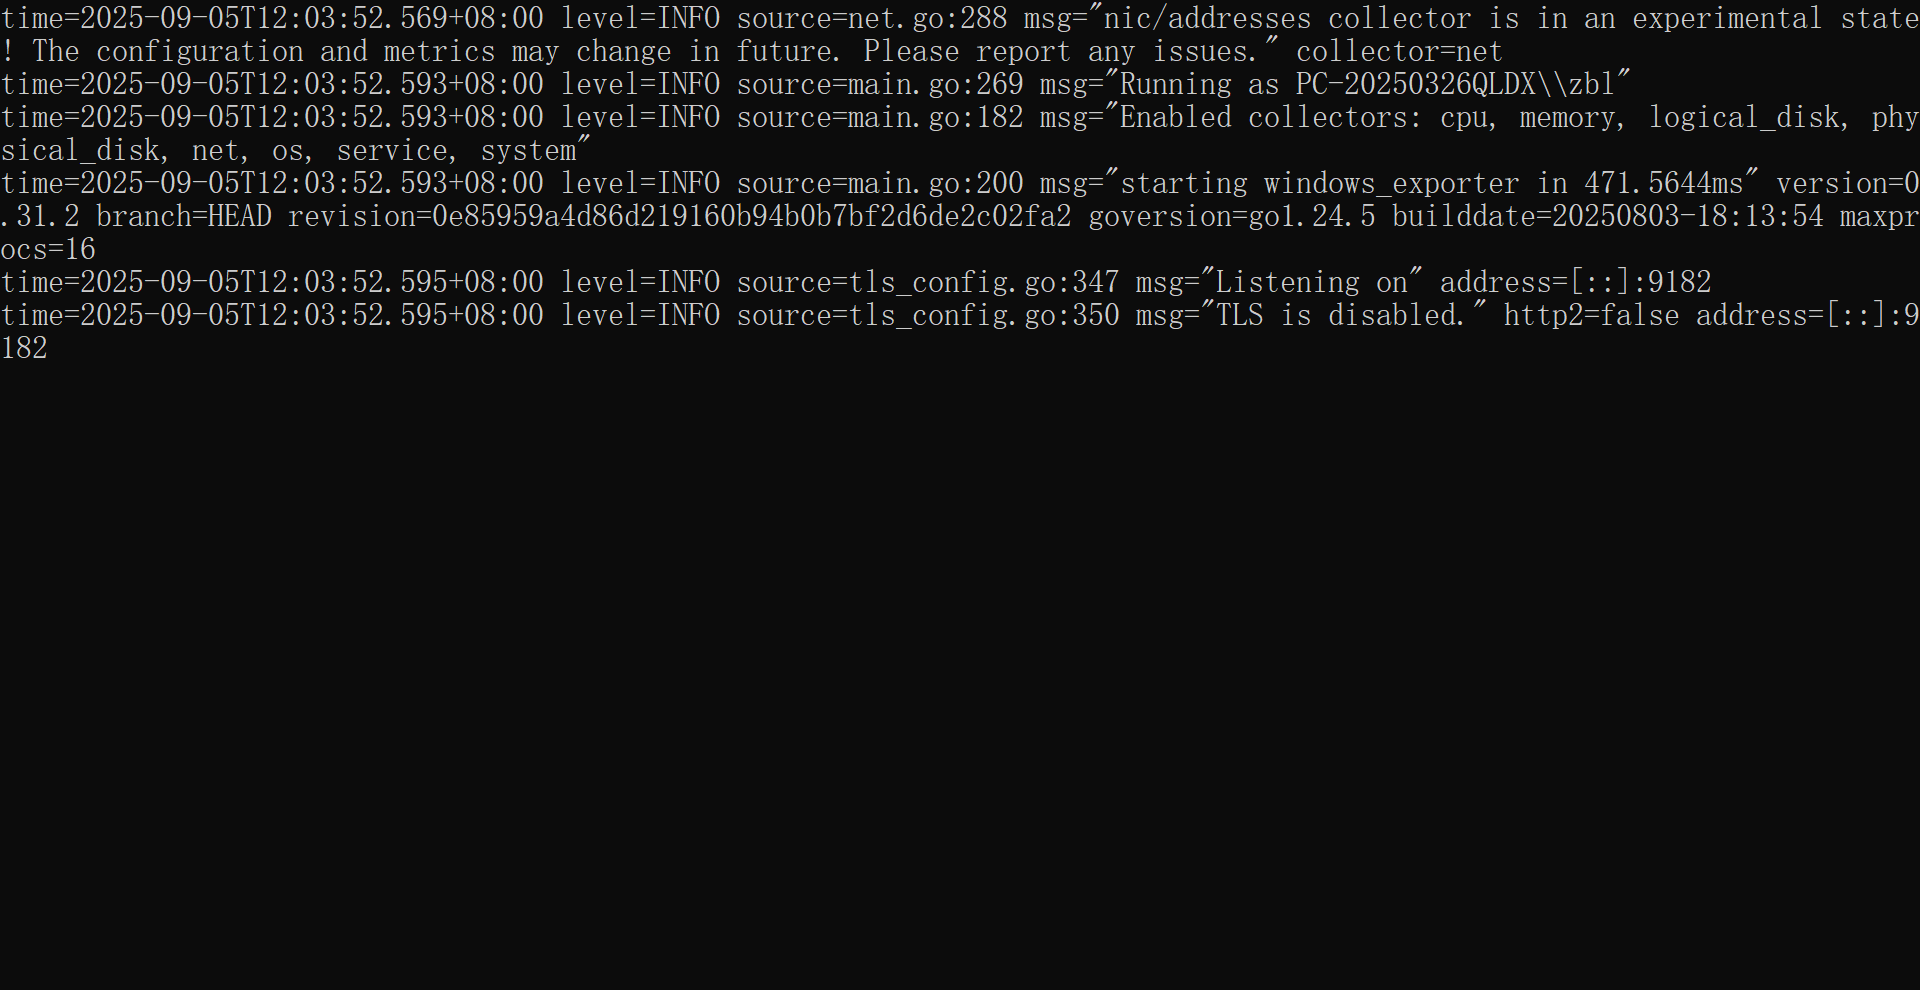
http://10.0.0.1:9182/metrics
[root@prometheus-server31 ~]# vim /app/tools/prometheus-2.53.4.linux-amd64/prometheus.yml
  - job_name: "windows-exporter"
    static_configs:
      - targets: ["10.0.0.1:9182"]
[root@prometheus-server31 ~]# curl -X POST 10.0.0.31:9090/-/reload
http://10.0.0.31:9090/targets?search=
20763
14694
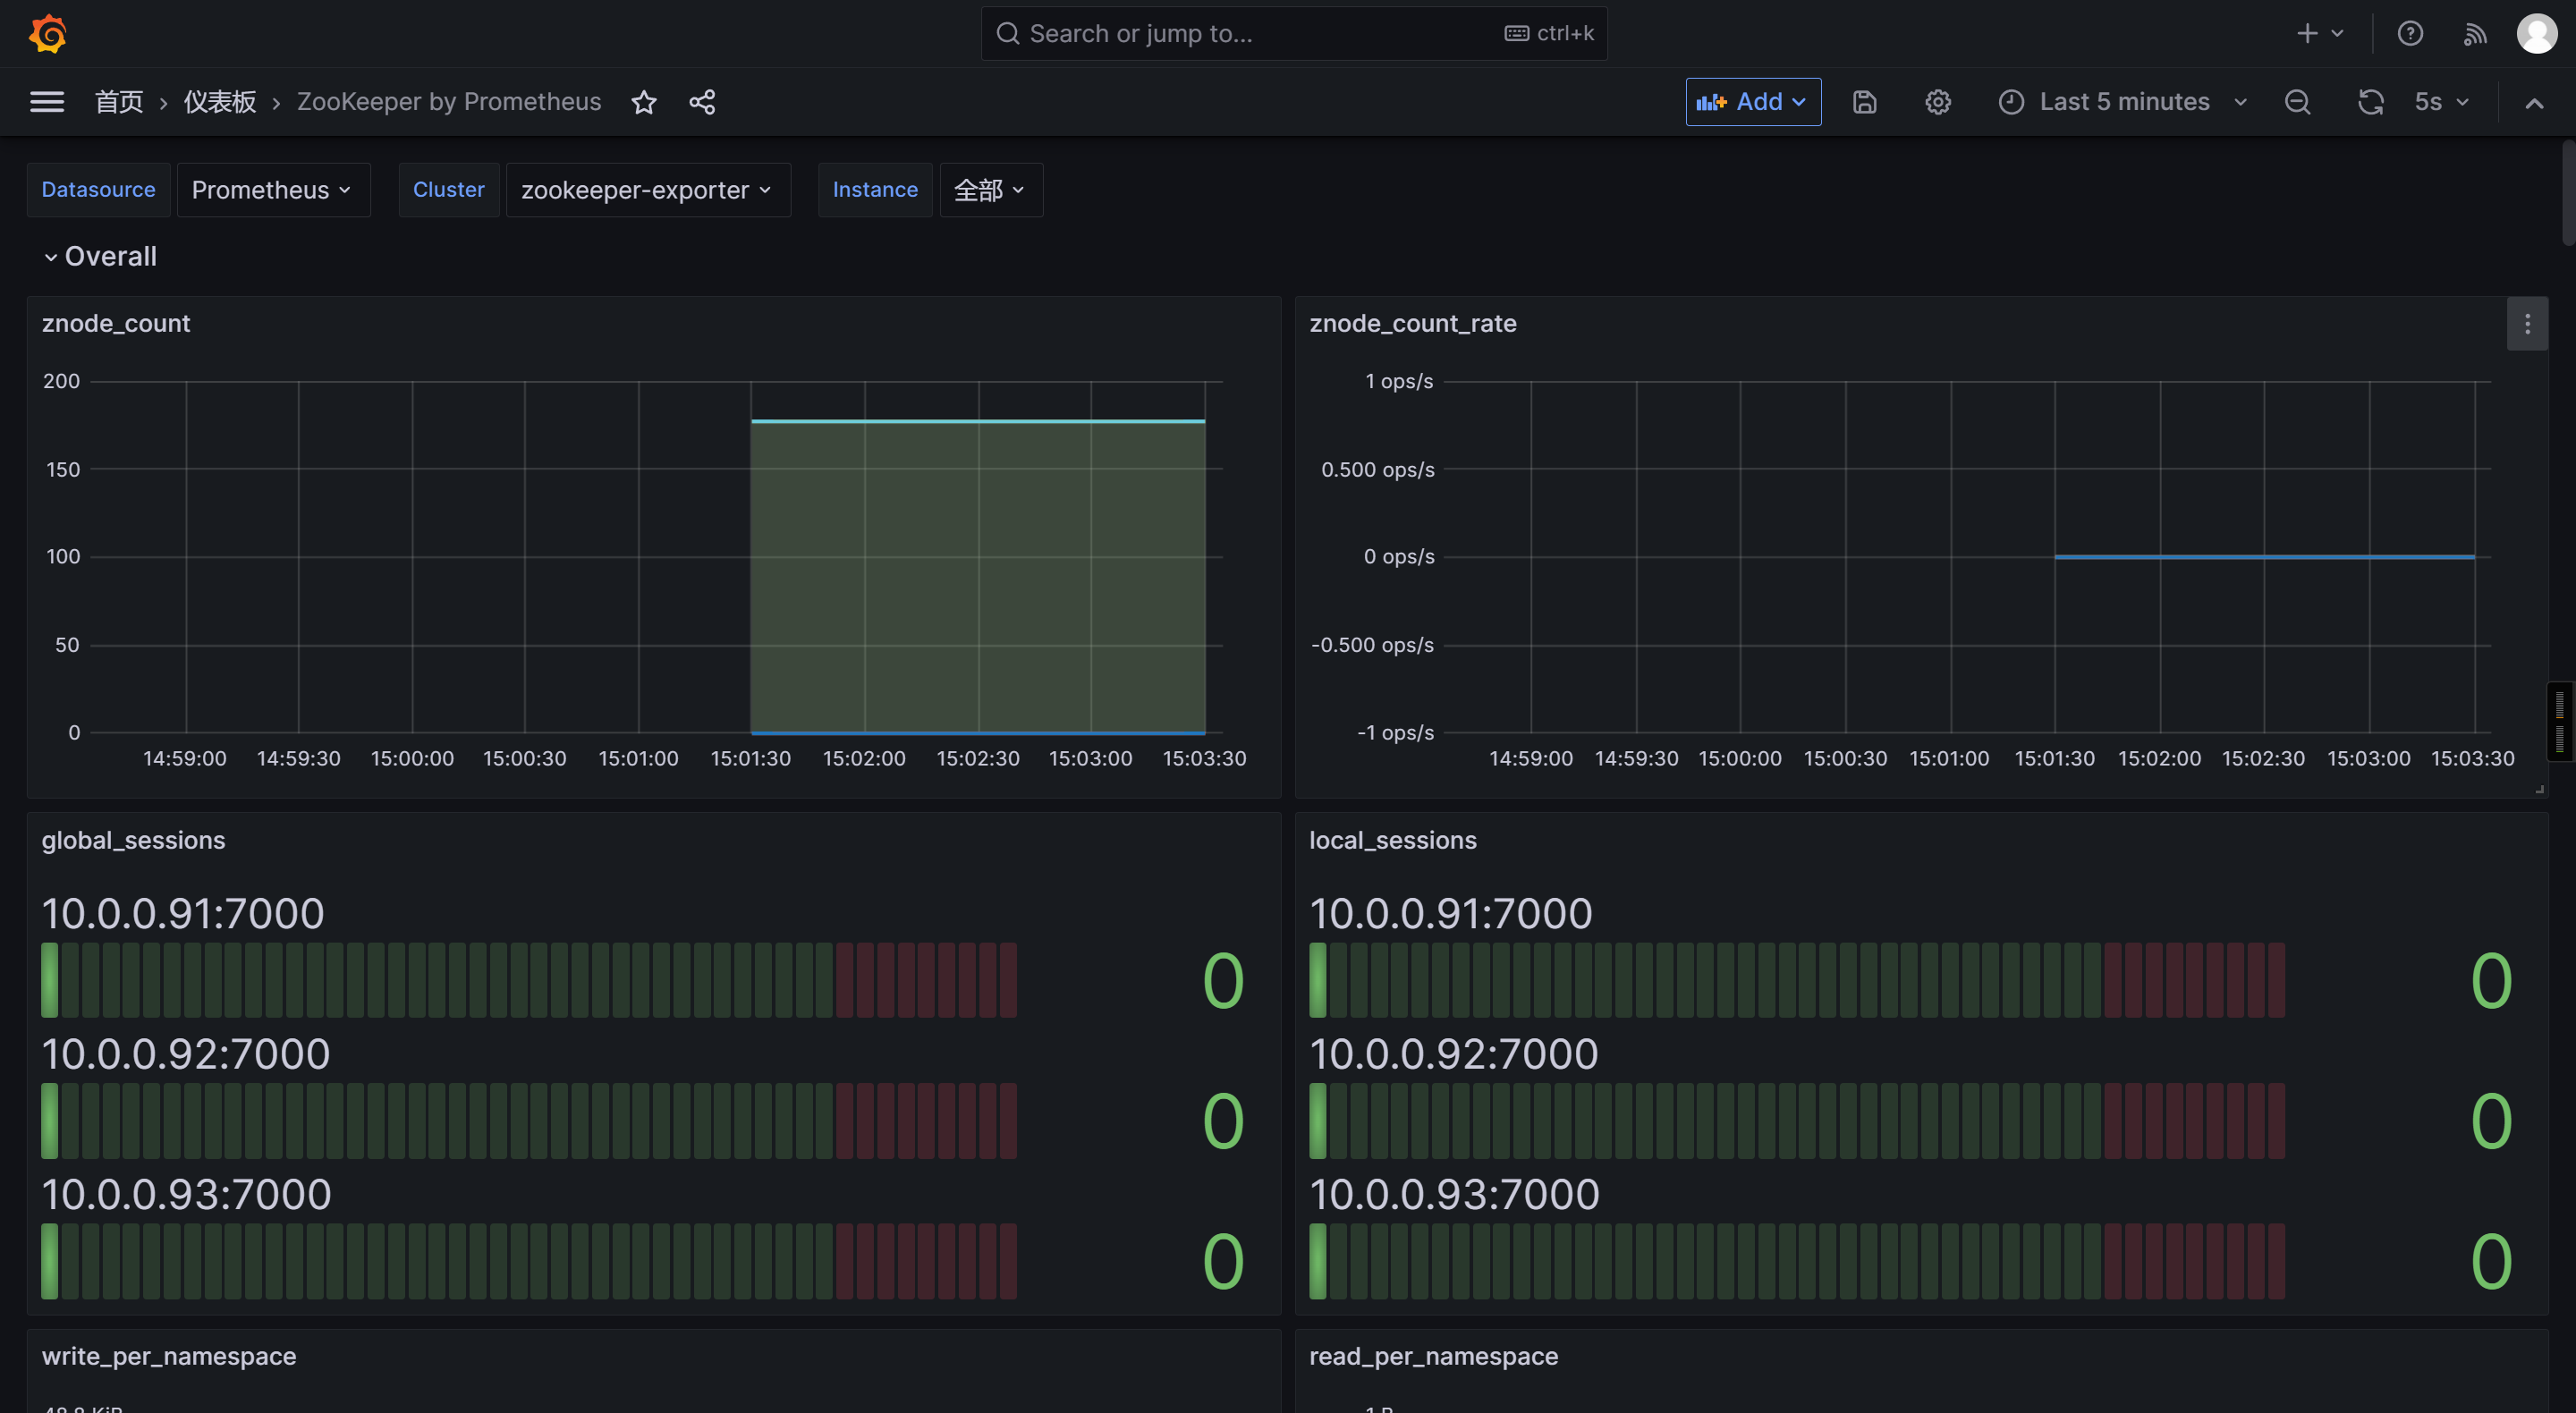
[root@elk91 ~]# vim /usr/local/apache-zookeeper-3.8.4-bin/conf/zoo.cfg
metricsProvider.className=org.apache.zookeeper.metrics.prometheus.PrometheusMetricsProvider
metricsProvider.httpHost=0.0.0.0
metricsProvider.httpPort=7000
metricsProvider.exportJvmInfo=true
[root@elk91 ~]# scp /usr/local/apache-zookeeper-3.8.4-bin/conf/zoo.cfg  10.0.0.92:/usr/local/apache-zookeeper-3.8.4-bin/conf
[root@elk91 ~]# scp /usr/local/apache-zookeeper-3.8.4-bin/conf/zoo.cfg  10.0.0.93:/usr/local/apache-zookeeper-3.8.4-bin/conf
[root@elk91 ~]# zkServer.sh start

[root@elk92 ~]# zkServer.sh start

[root@elk93 ~]# zkServer.sh start
http://10.0.0.91:7000/metrics
http://10.0.0.92:7000/metrics
http://10.0.0.93:7000/metrics
[root@prometheus-server31 ~]# vim /app/tools/prometheus-2.53.4.linux-amd64/prometheus.yml
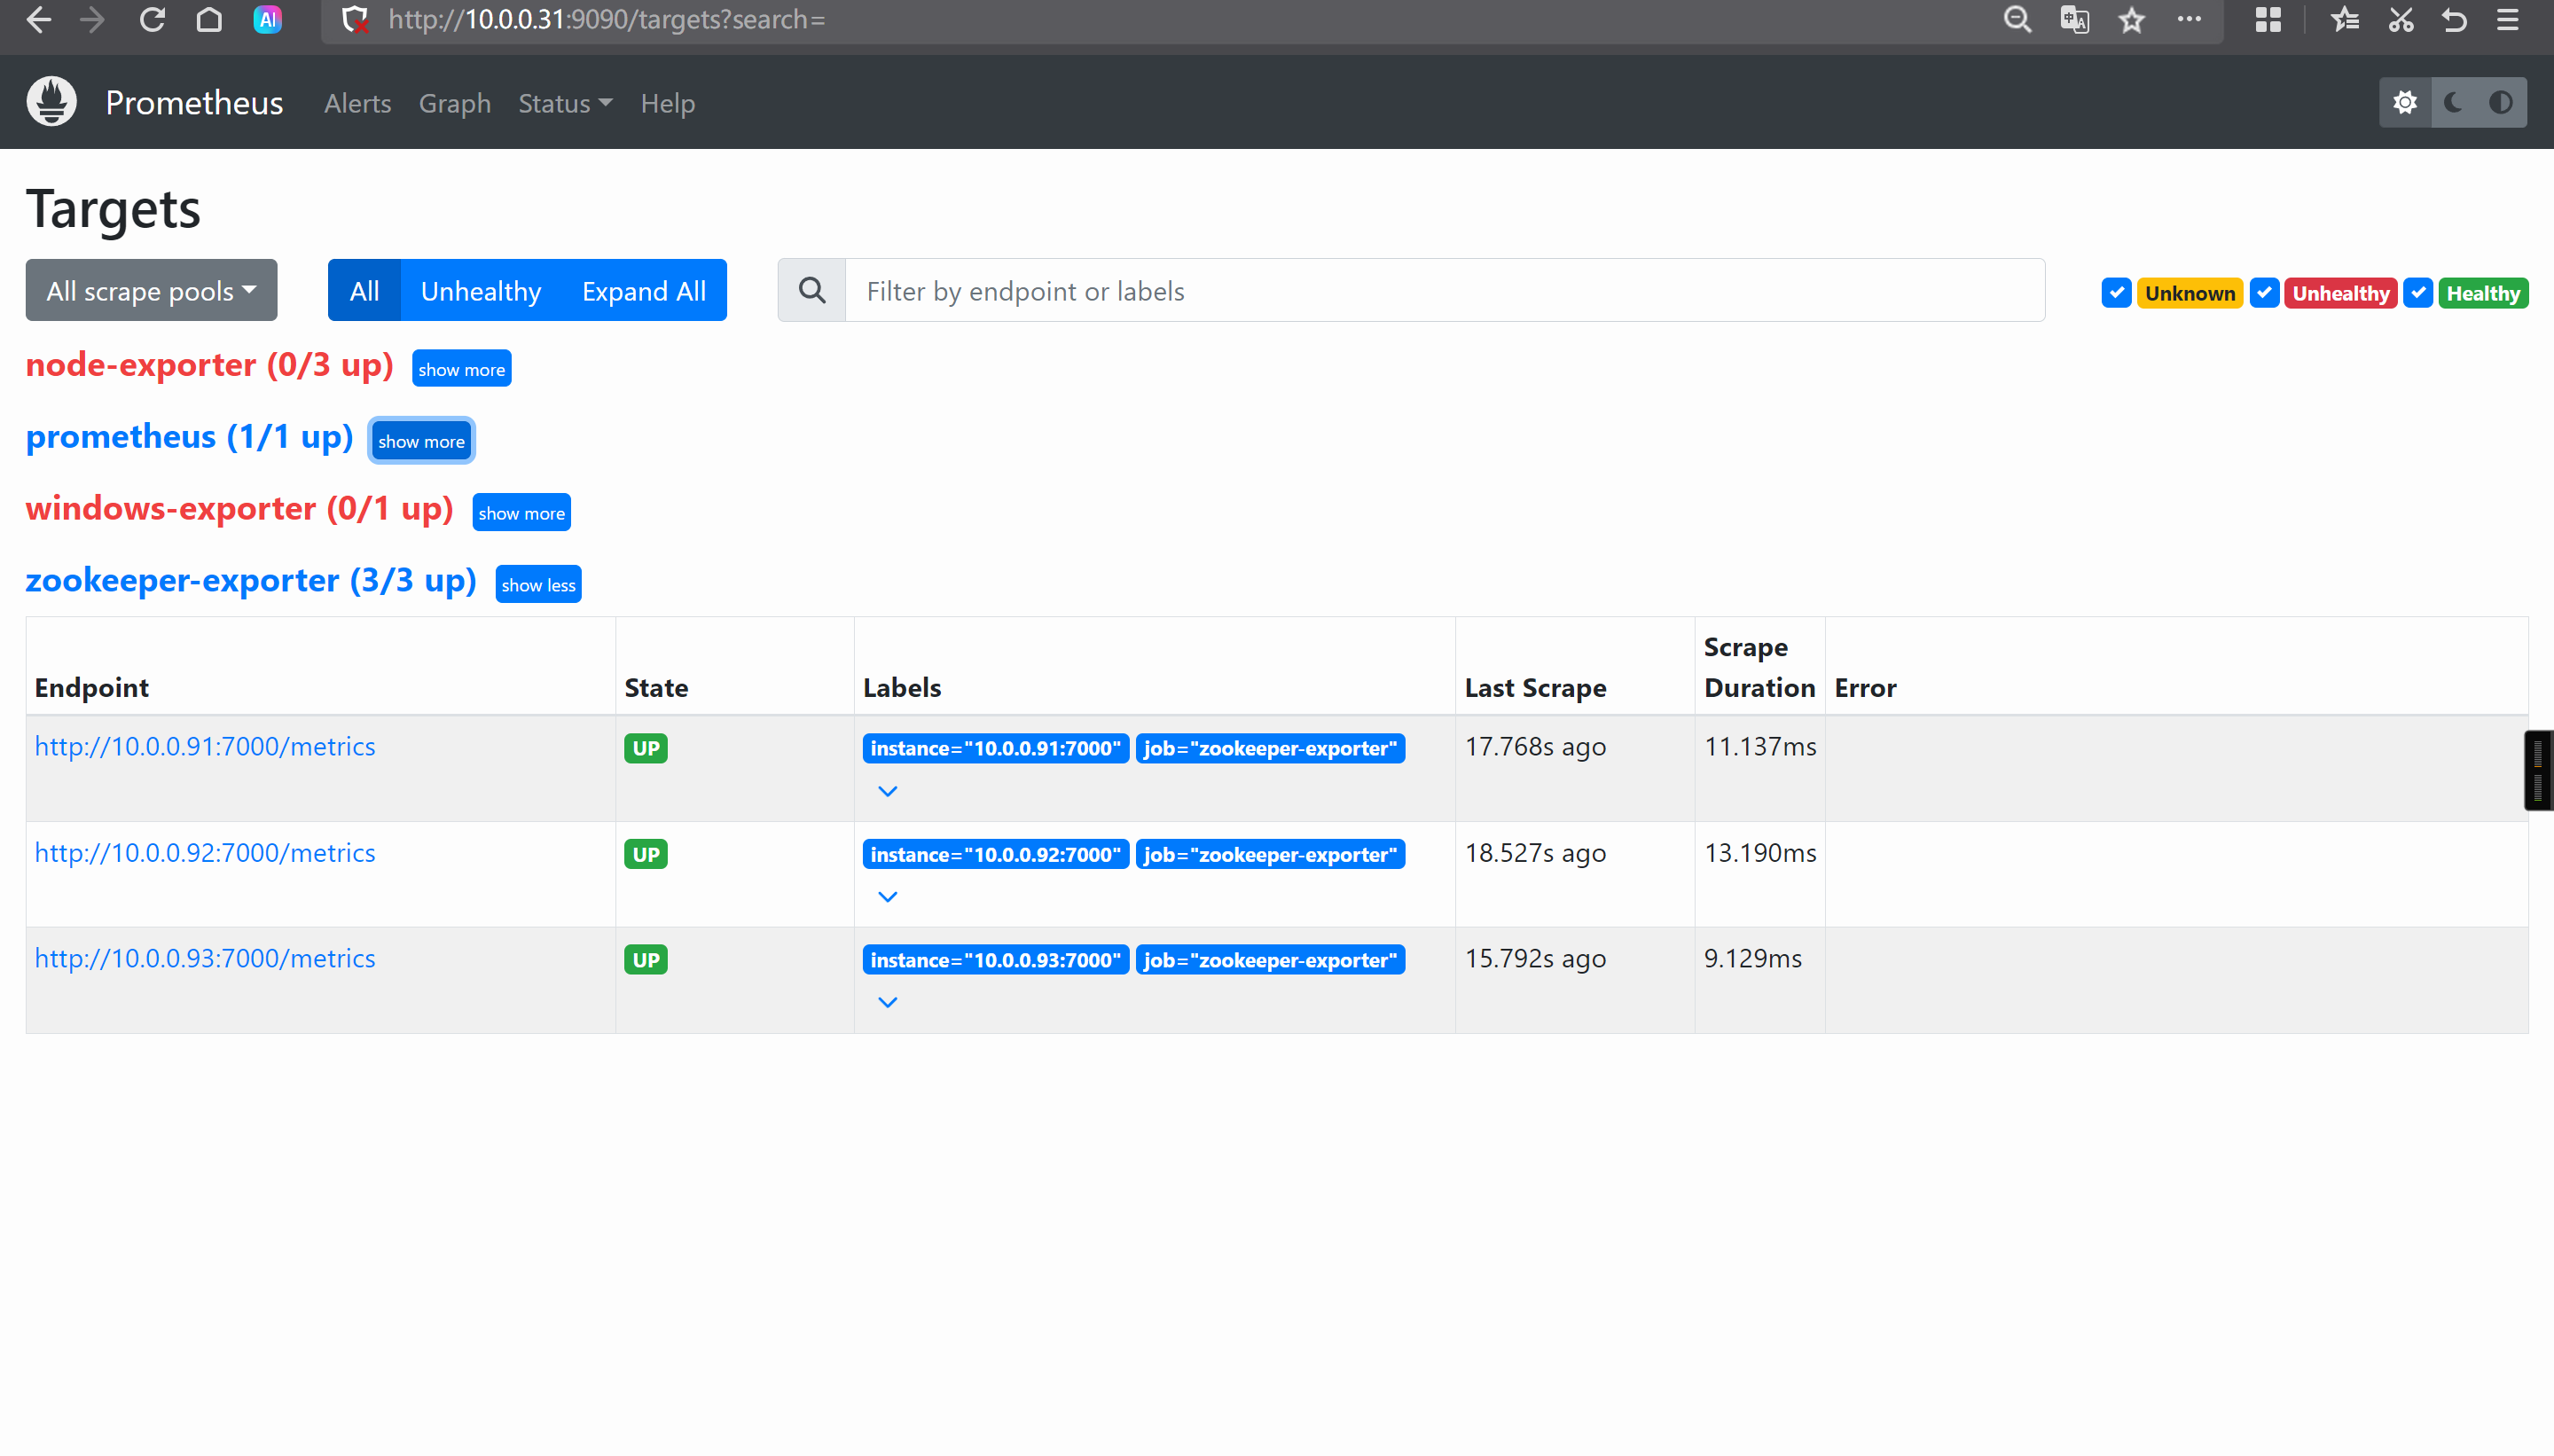
- job_name: "zookeeper-exporter"
static_configs:
- targets:
- 10.0.0.91:7000
- 10.0.0.92:7000
- 10.0.0.93:7000
[root@prometheus-server31 ~]# curl -X POST 10.0.0.31:9090/-/reload
10465
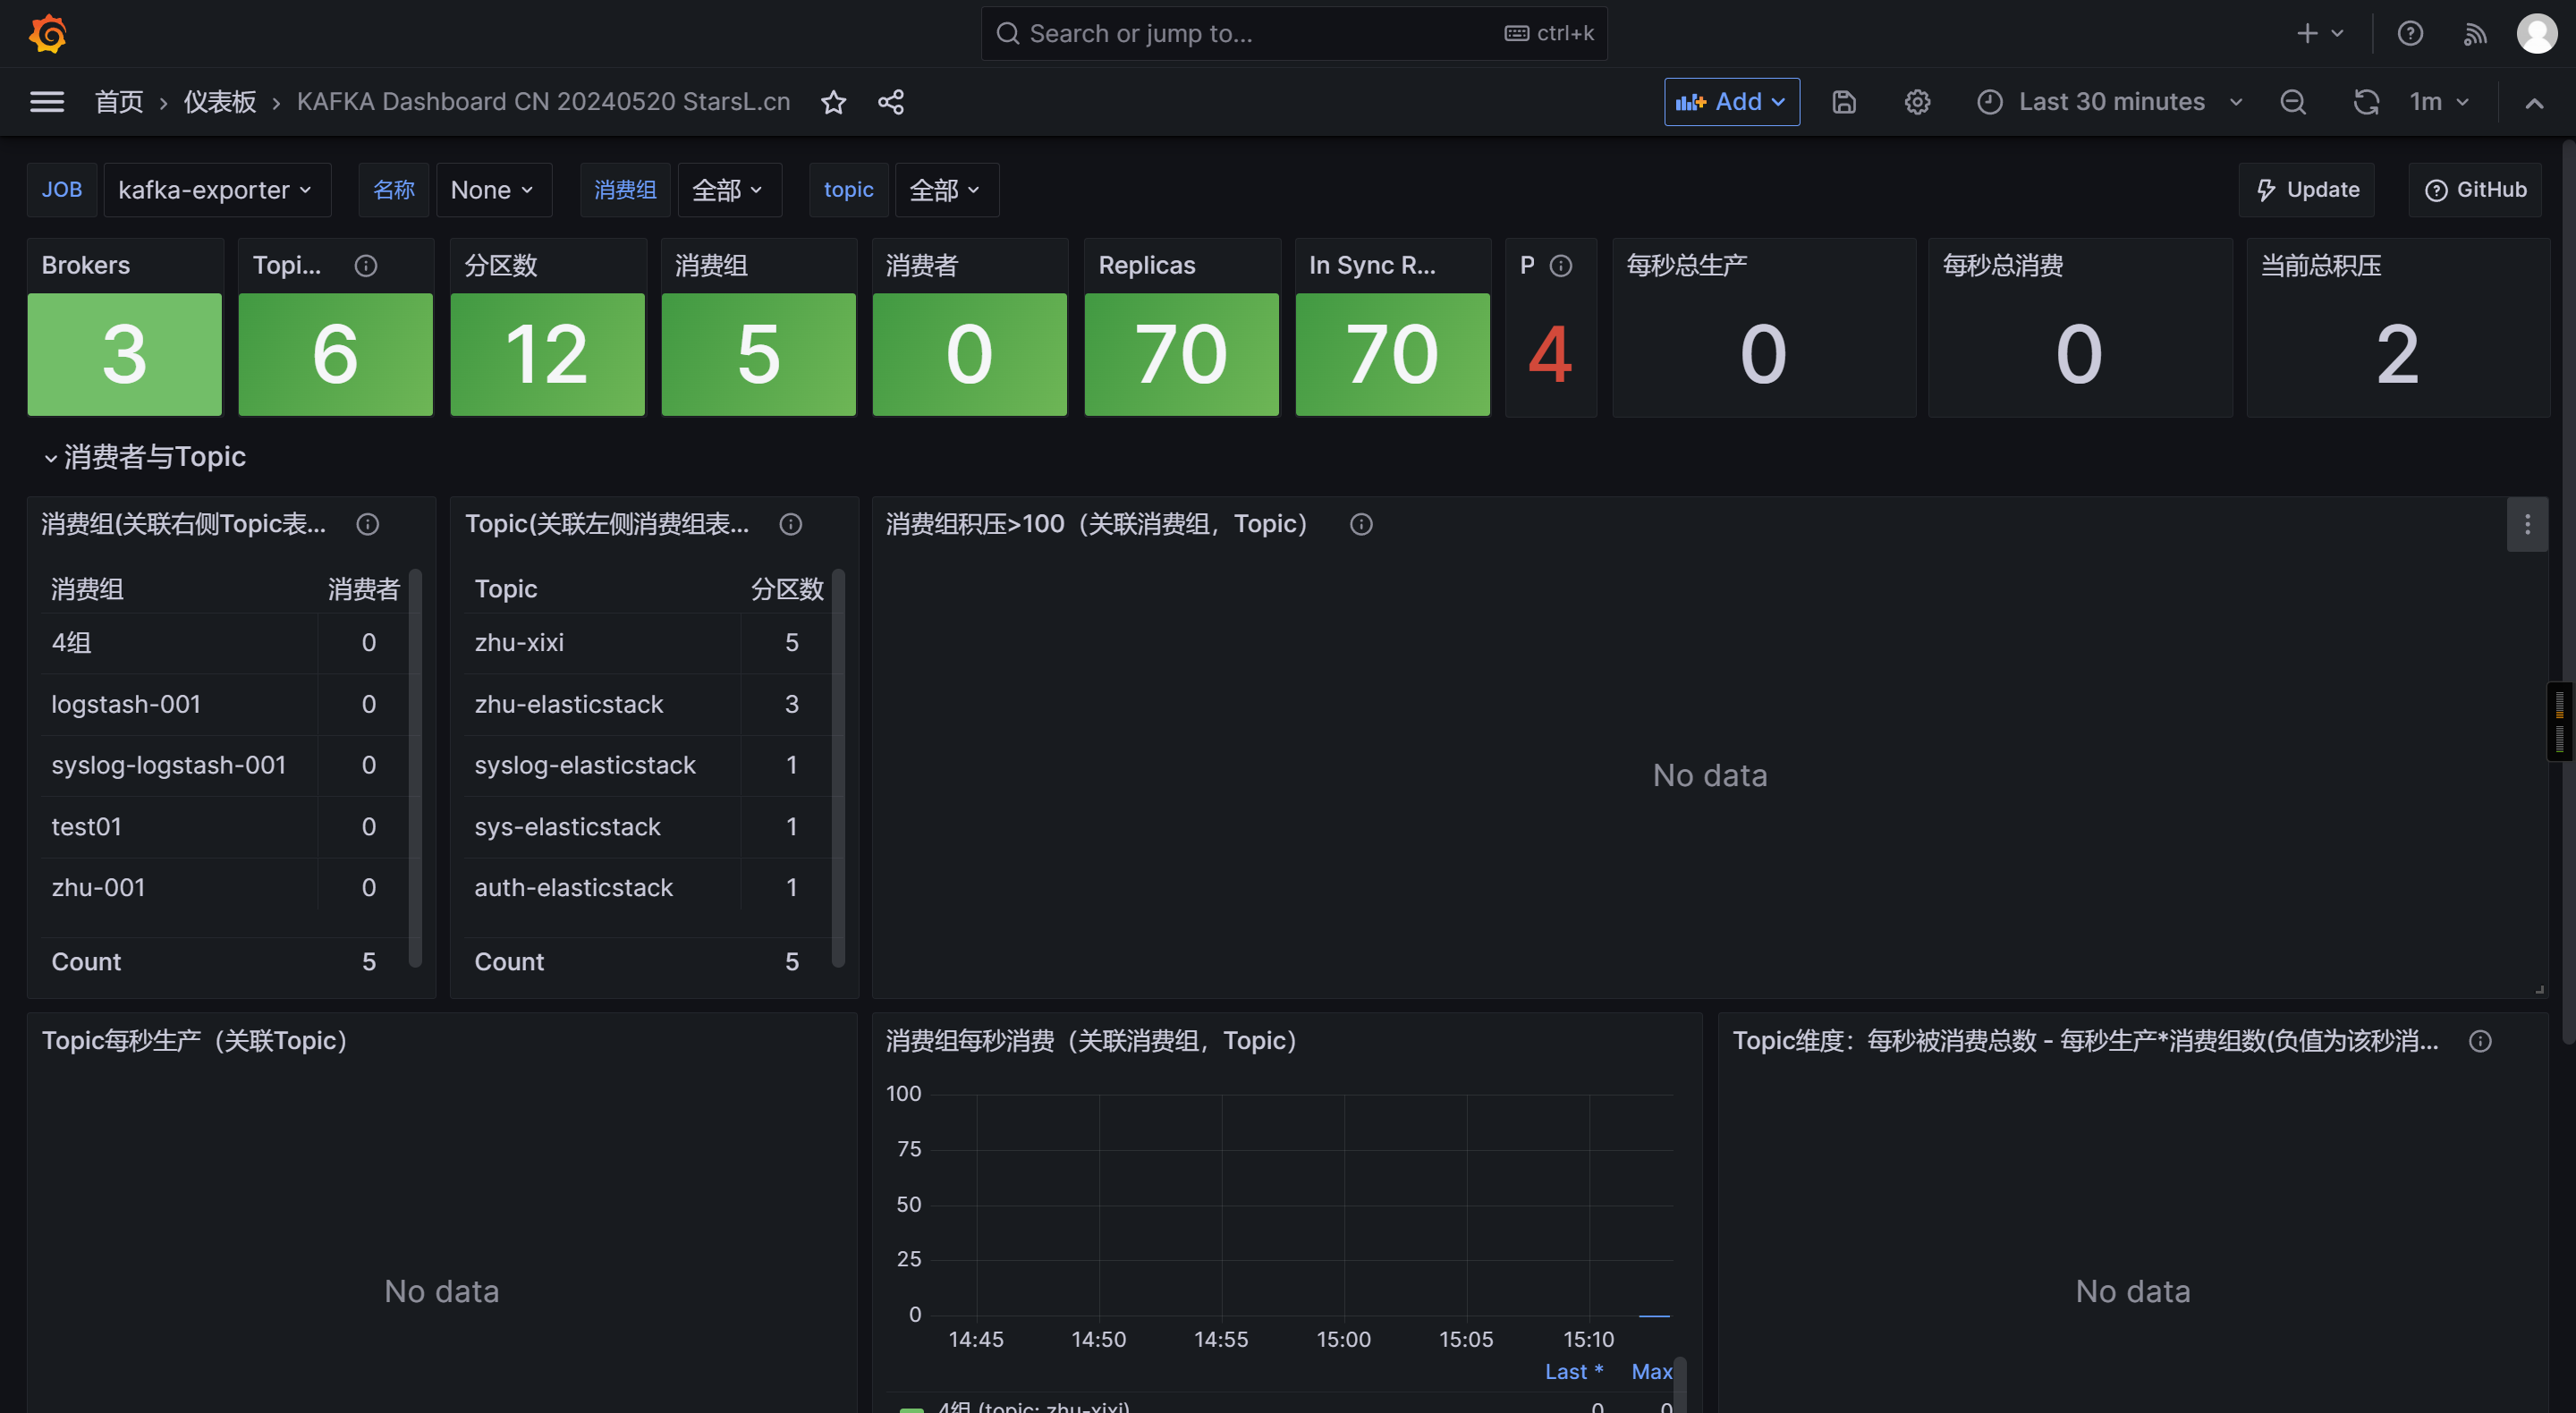
[root@elk91 ~]# kafka-server-start.sh -daemon $KAFKA_HOME/config/server.properties

wget https://github.com/danielqsj/kafka_exporter/releases/download/v1.9.0/kafka_exporter-1.9.0.linux-amd64.tar.gz
[root@elk91 ~]# tar xf kafka_exporter-1.9.0.linux-amd64.tar.gz -C /usr/local/bin/ kafka_exporter-1.9.0.linux-amd64/kafka_exporter --strip-components=1

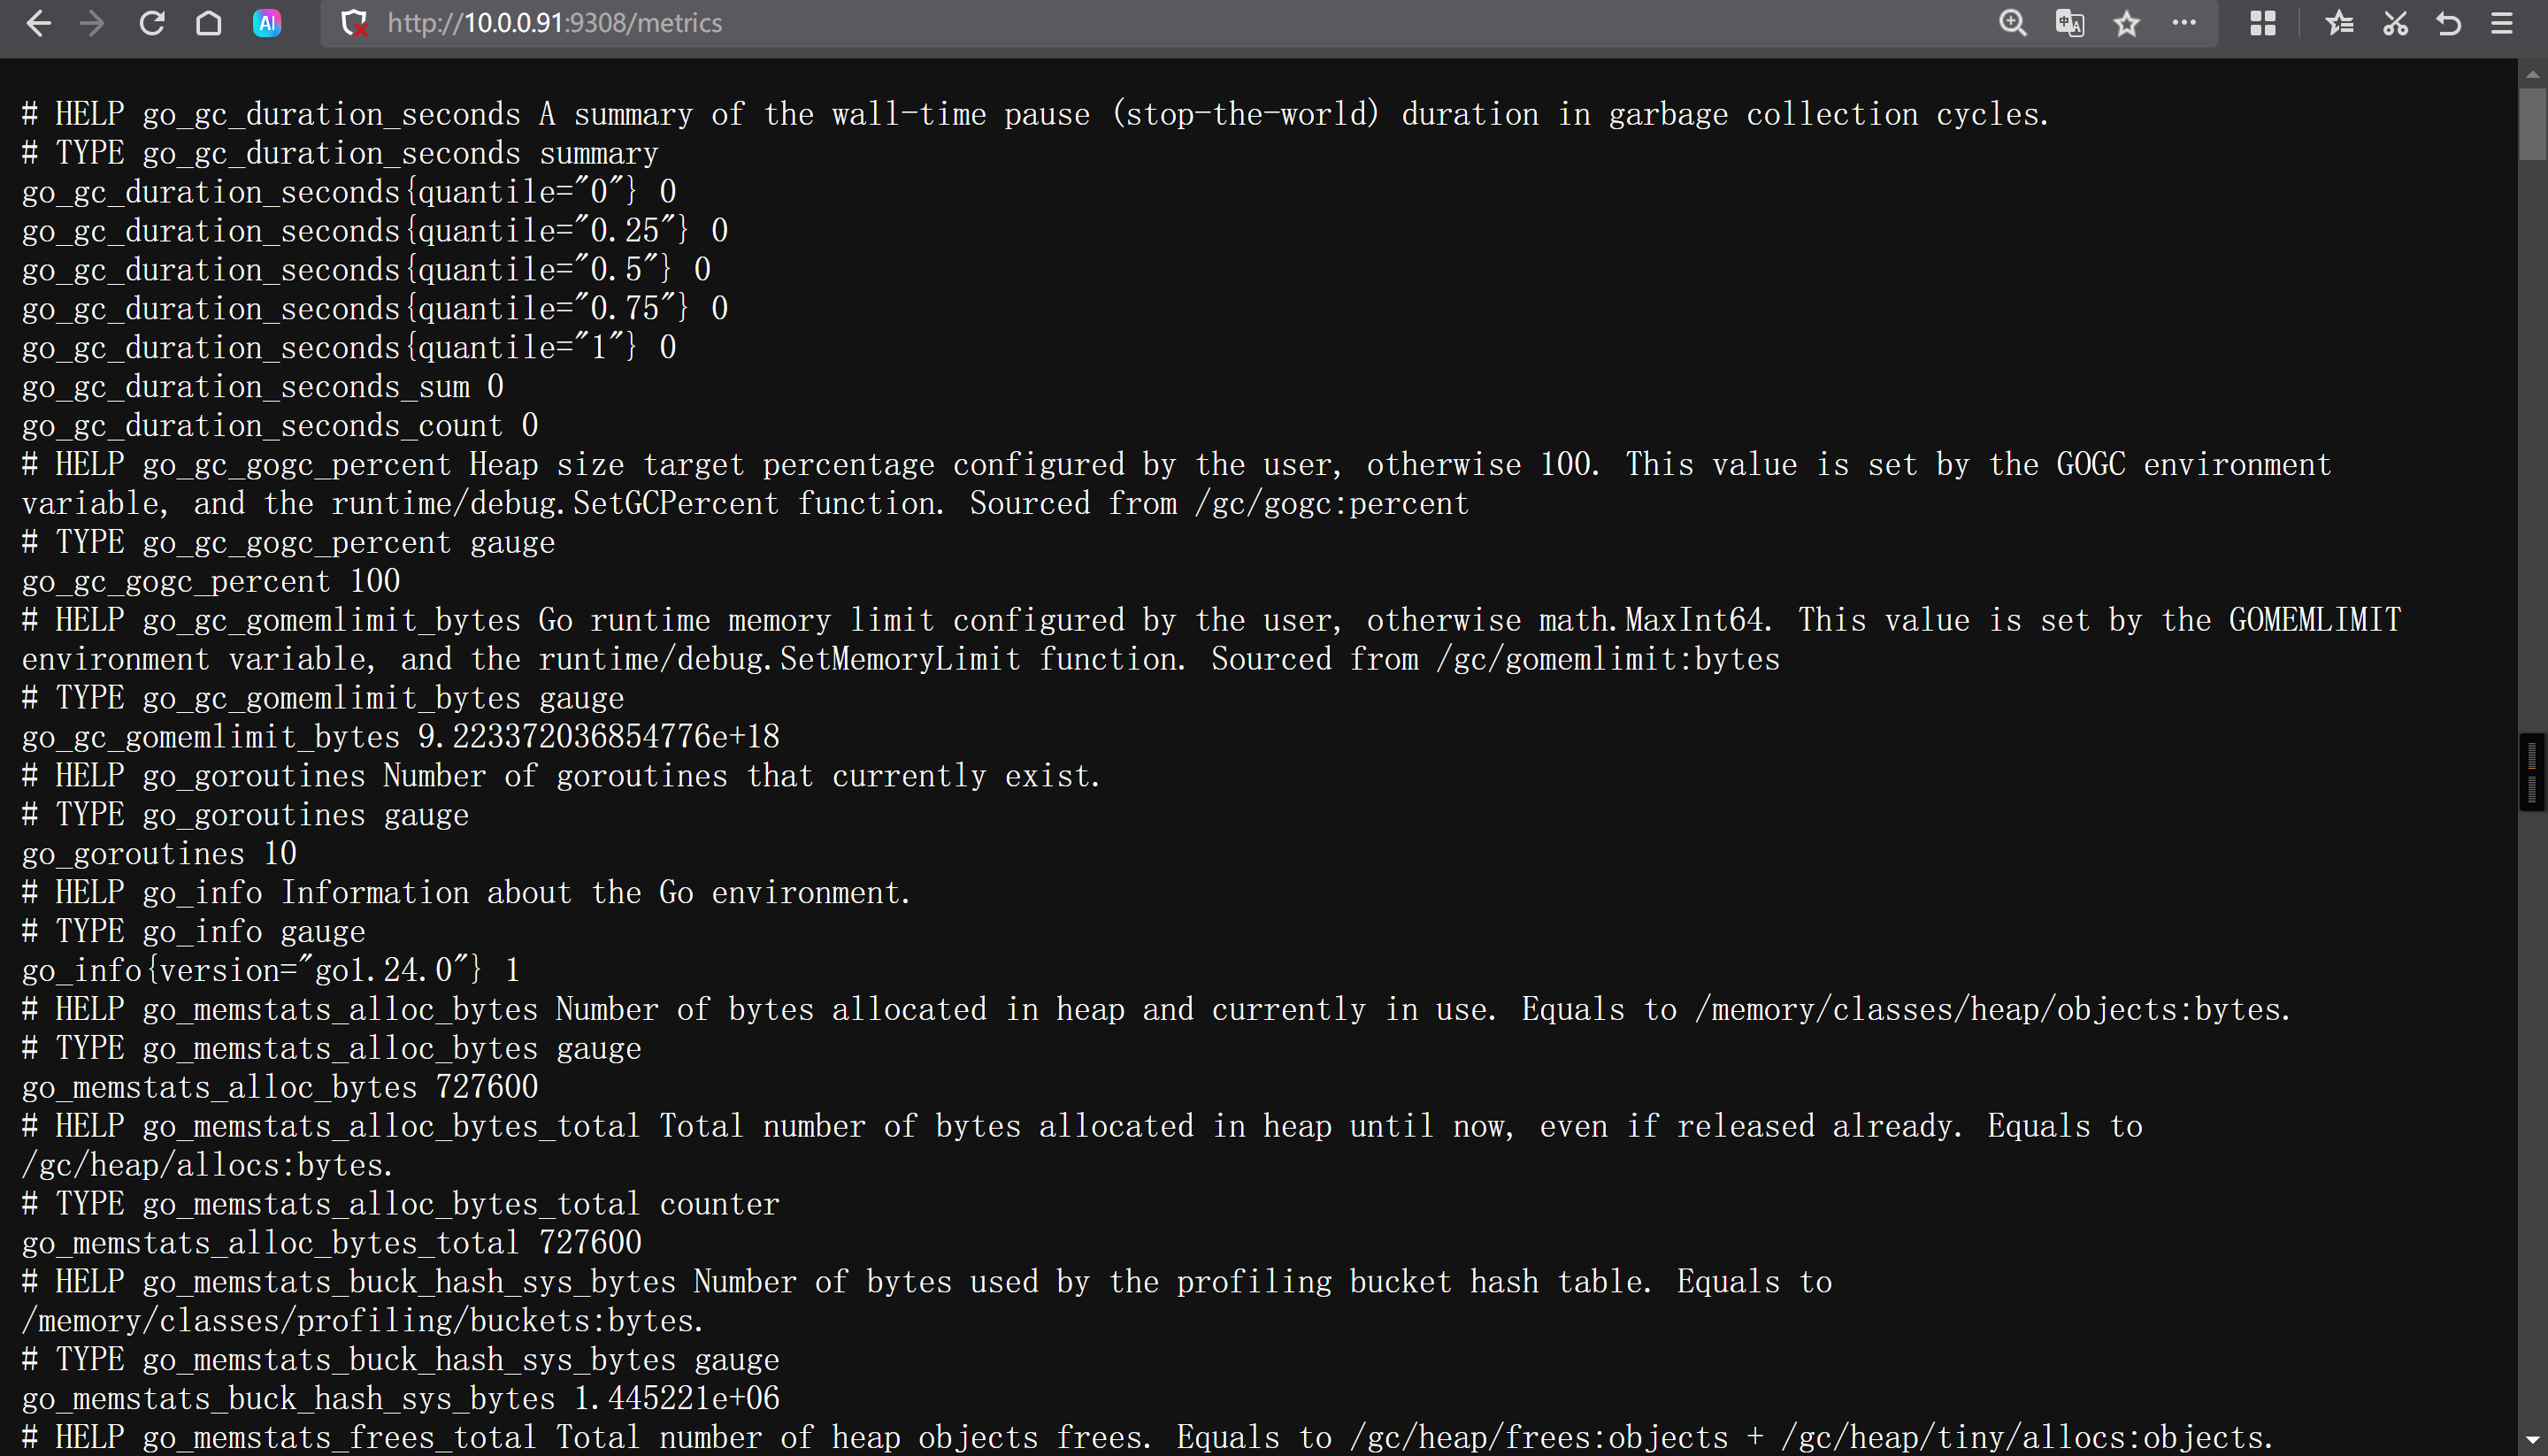
[root@elk91 ~]# kafka_exporter --kafka.version="3.9.1" --kafka.server=10.0.0.92:9092 --web.listen-address=":9308" --web.telemetry-path="/metrics"

http://10.0.0.91:9308/metrics
[root@prometheus-server31 ~]# vim /app/tools/prometheus-2.53.4.linux-amd64/prometheus.yml
  - job_name: "kafka-exporter"
    static_configs:
      - targets:
          - 10.0.0.91:9308
[root@prometheus-server31 ~]# curl -X POST 10.0.0.31:9090/-/reload
http://10.0.0.31:9090/targets?search=
21078
7589
curl https://10.0.0.91:9200/_cat/nodes -u elastic:123456 -k

wget https://github.com/prometheus-community/elasticsearch_exporter/releases/download/v1.9.0/elasticsearch_exporter-1.9.0.linux-amd64.tar.gz
[root@elk92 ~]# tar xf elasticsearch_exporter-1.9.0.linux-amd64.tar.gz -C /usr/local/bin/ elasticsearch_exporter-1.9.0.linux-amd64/elasticsearch_exporter --strip-components=1

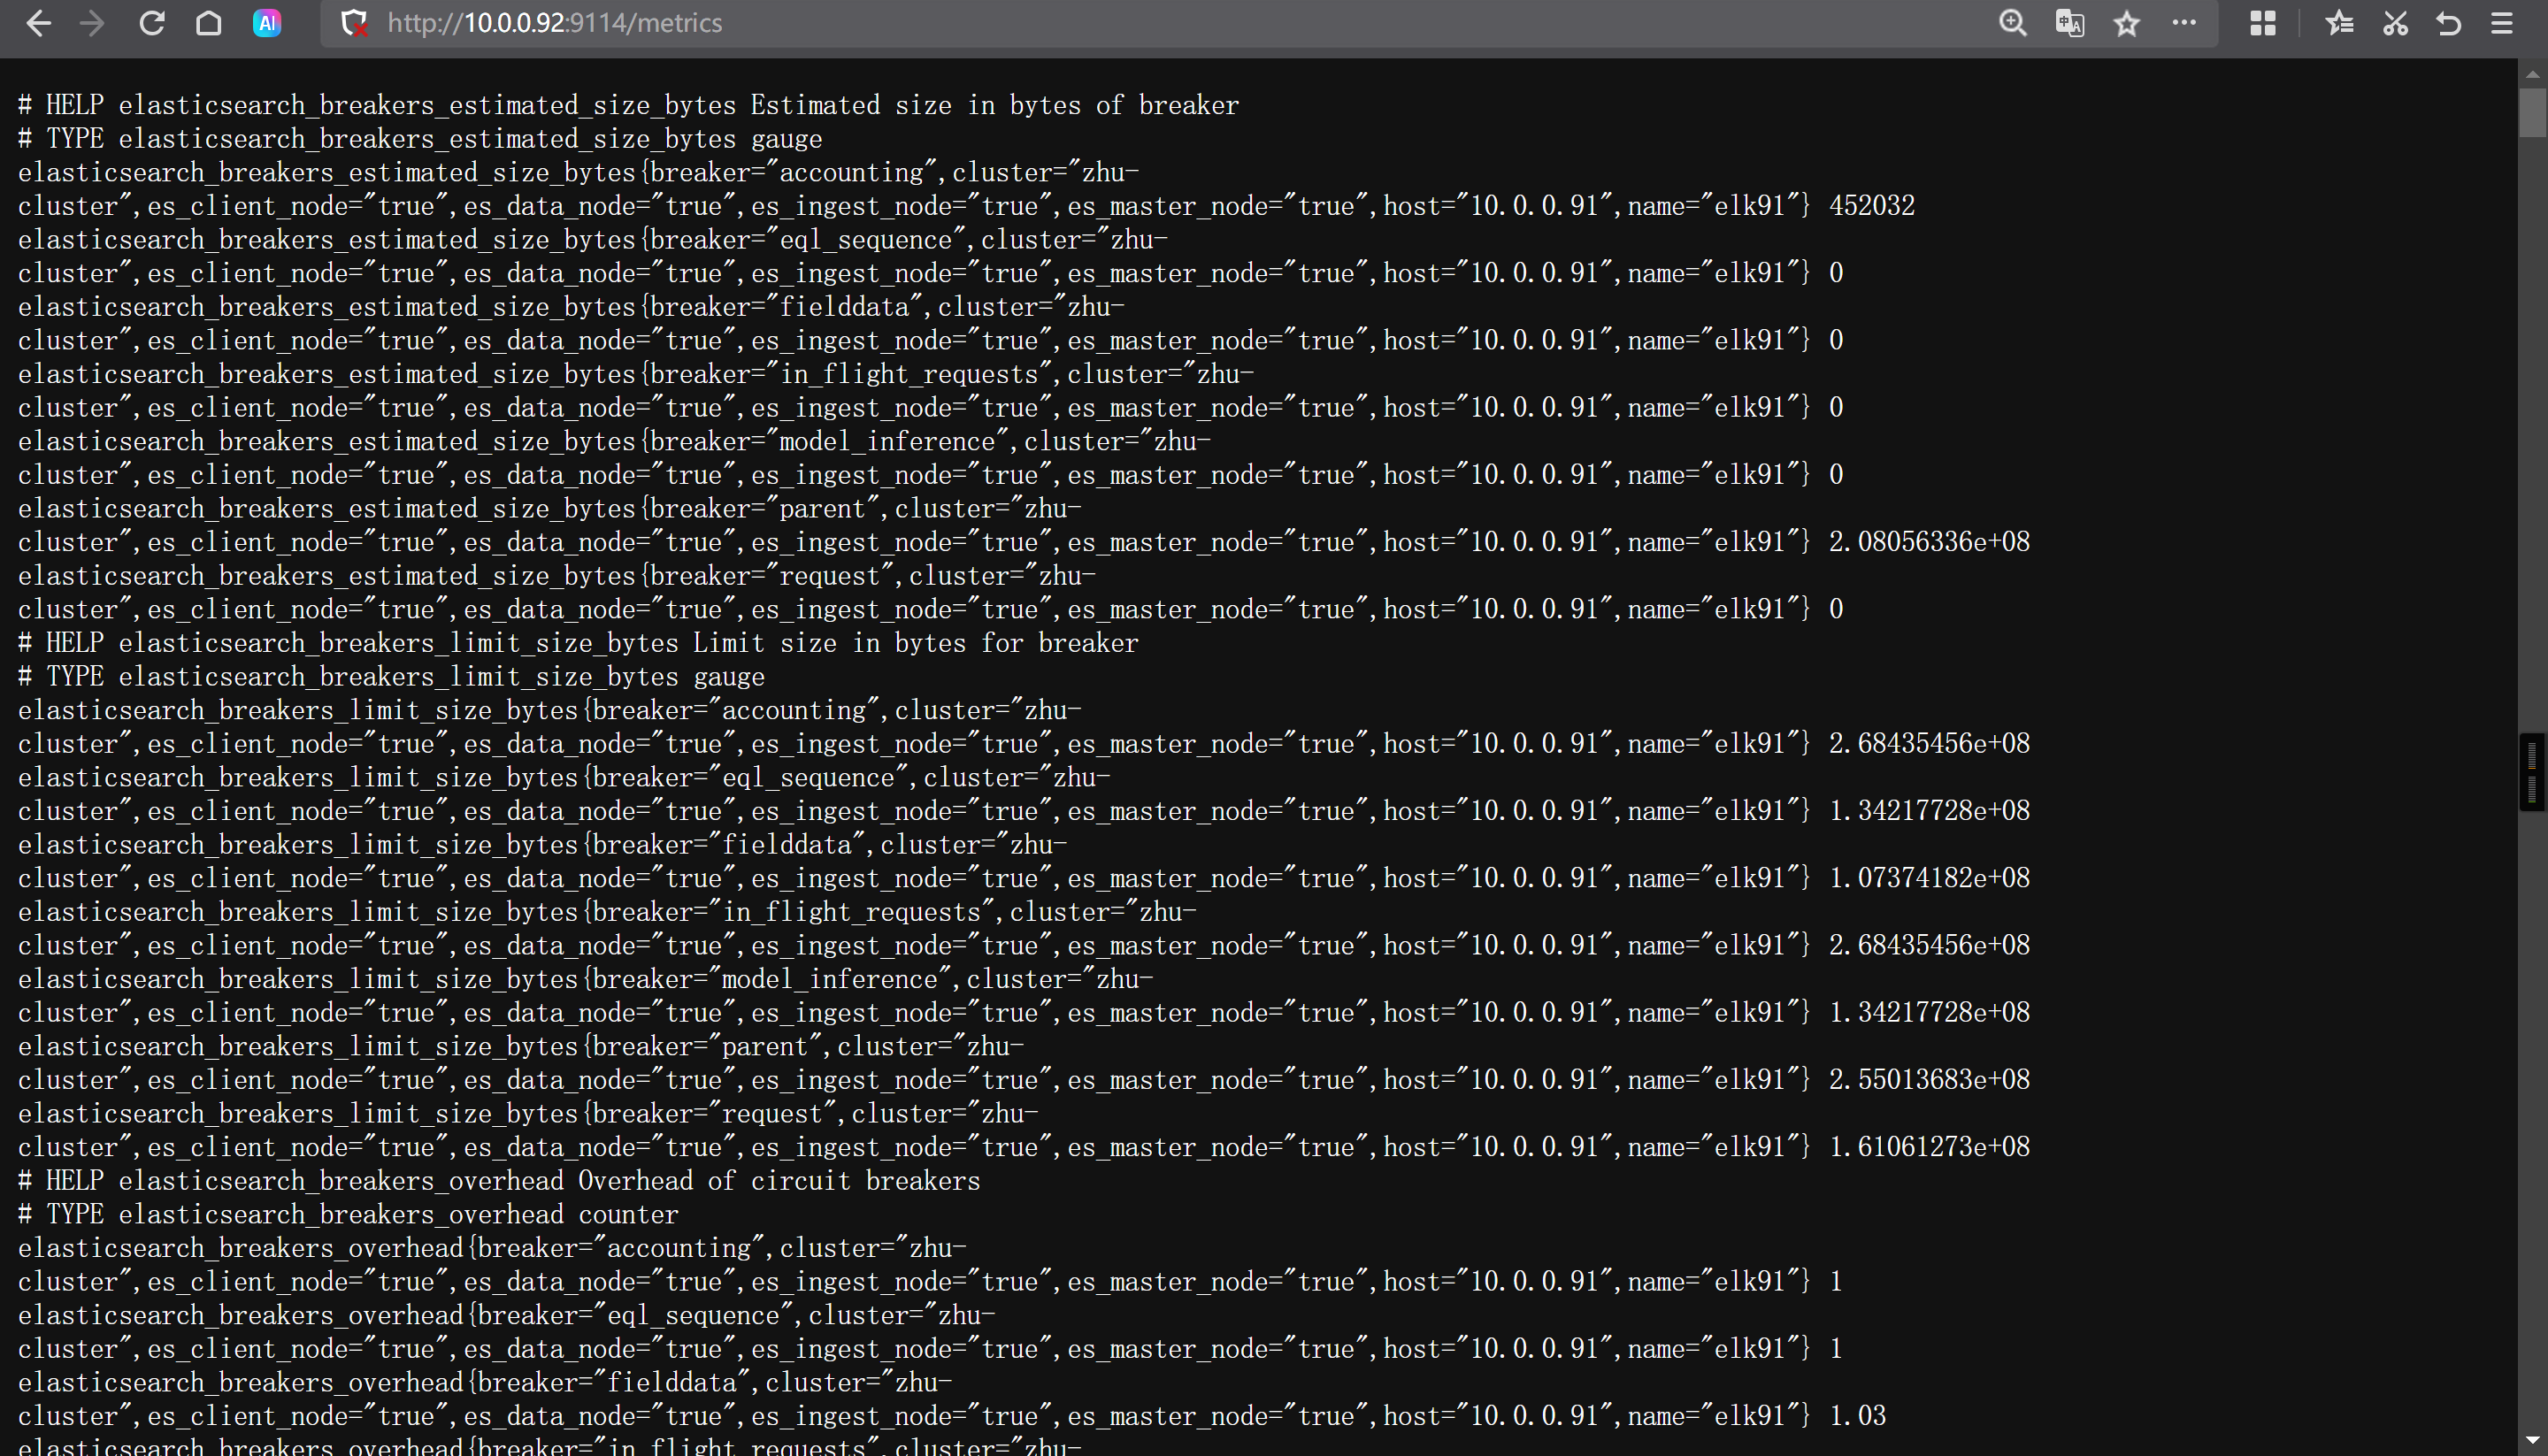
[root@elk92 ~]# elasticsearch_exporter --es.uri="https://elastic:123456@10.0.0.91:9200" --web.listen-address=:9114 --web.telemetry-path="/metrics" --es.ssl-skip-verify
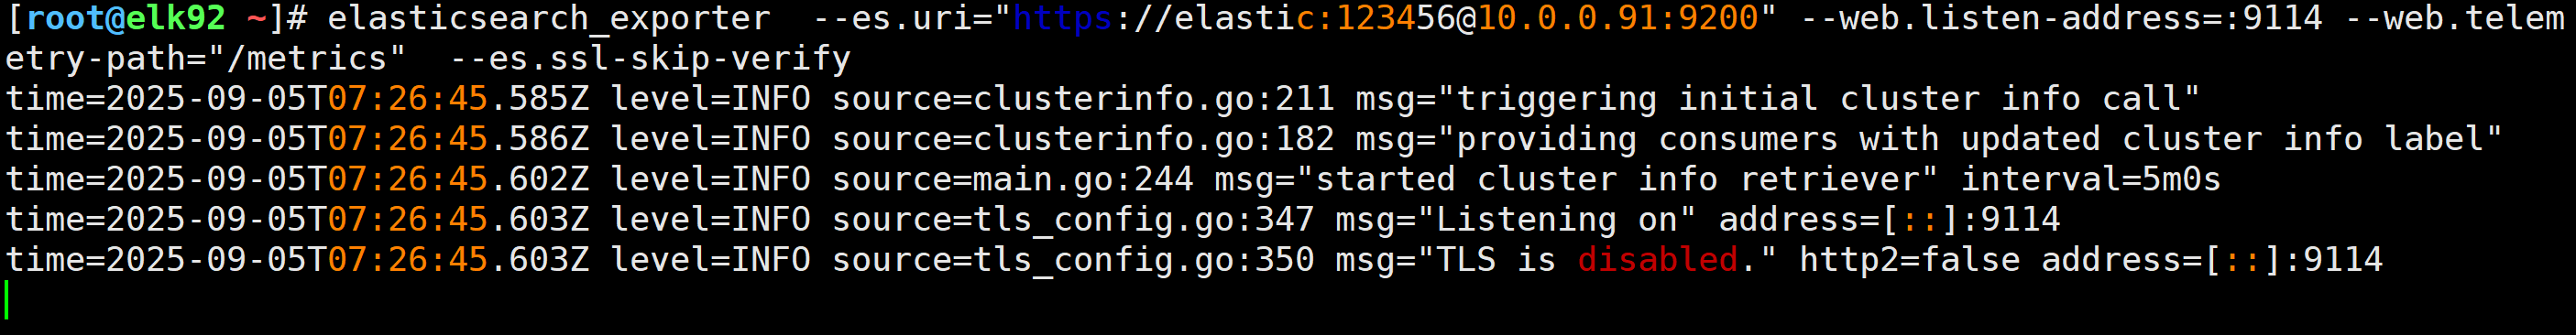
http://10.0.0.92:9114/metrics
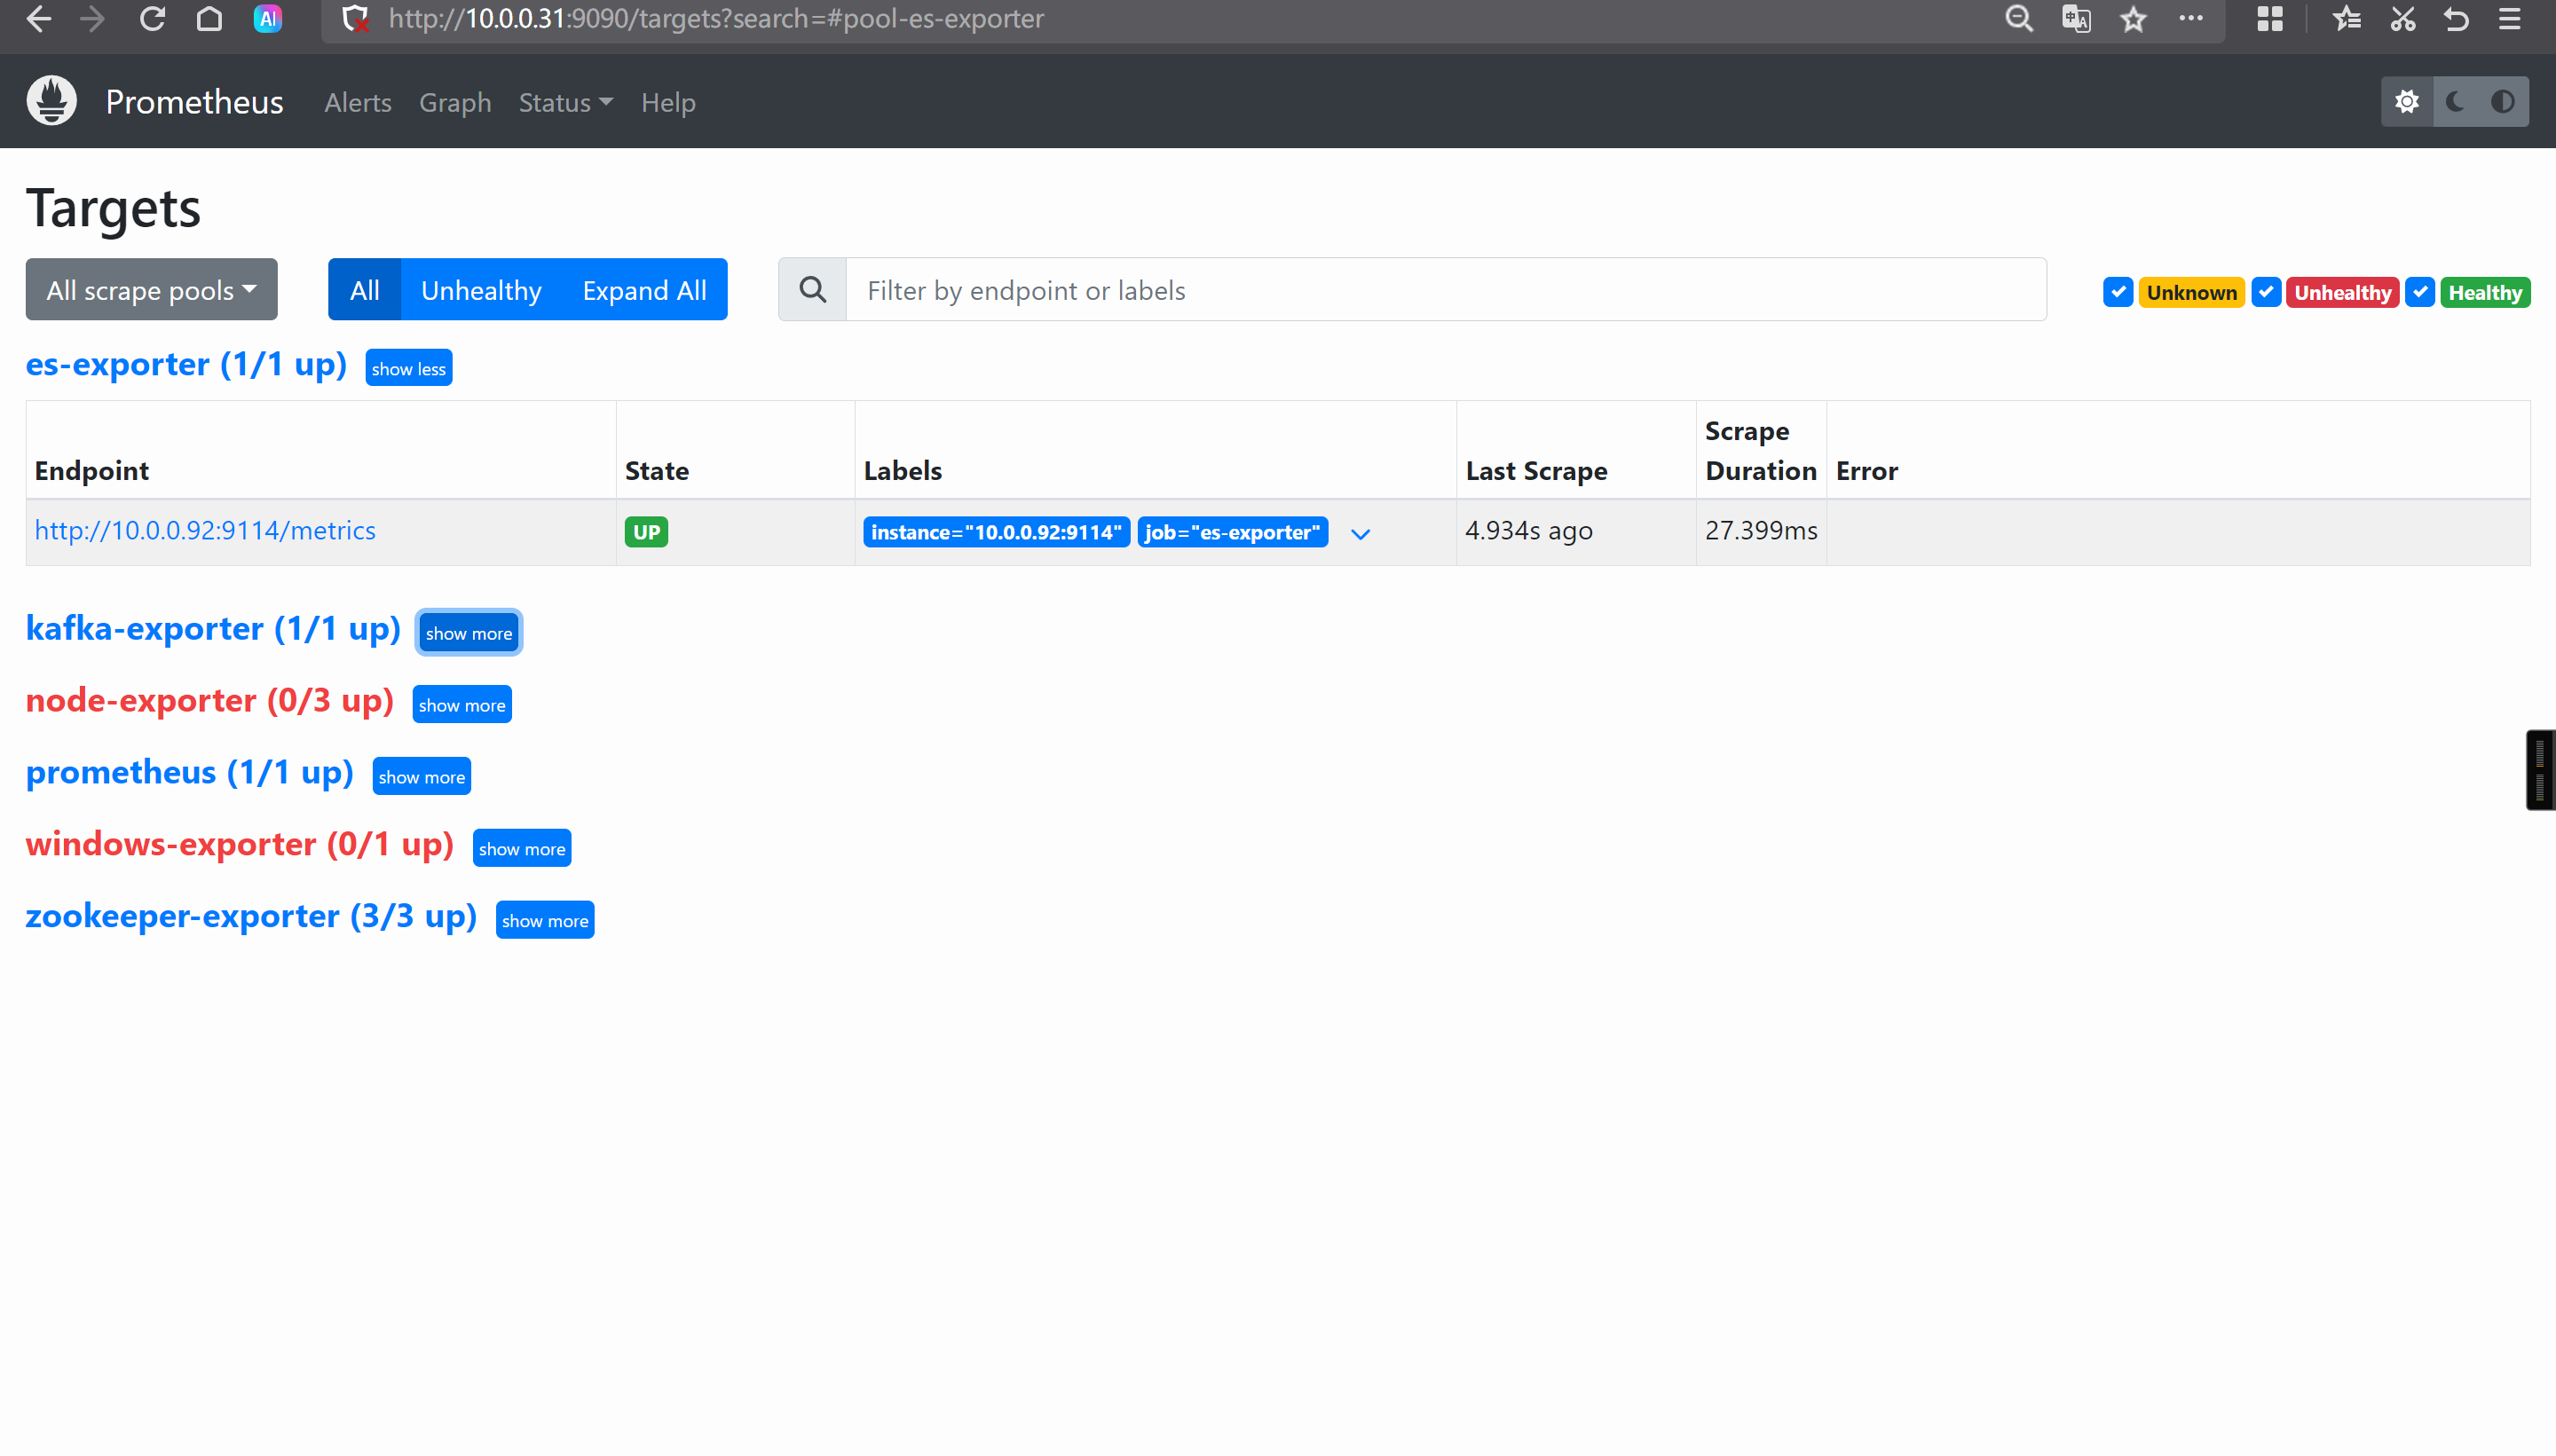
[root@prometheus-server31 ~]# vim /app/tools/prometheus-2.53.4.linux-amd64/prometheus.yml
  - job_name: "es-exporter"
    static_configs:
      - targets:
          - 10.0.0.92:9114
[root@prometheus-server31 ~]# curl -X POST 10.0.0.31:9090/-/reload
14191
参考链接:
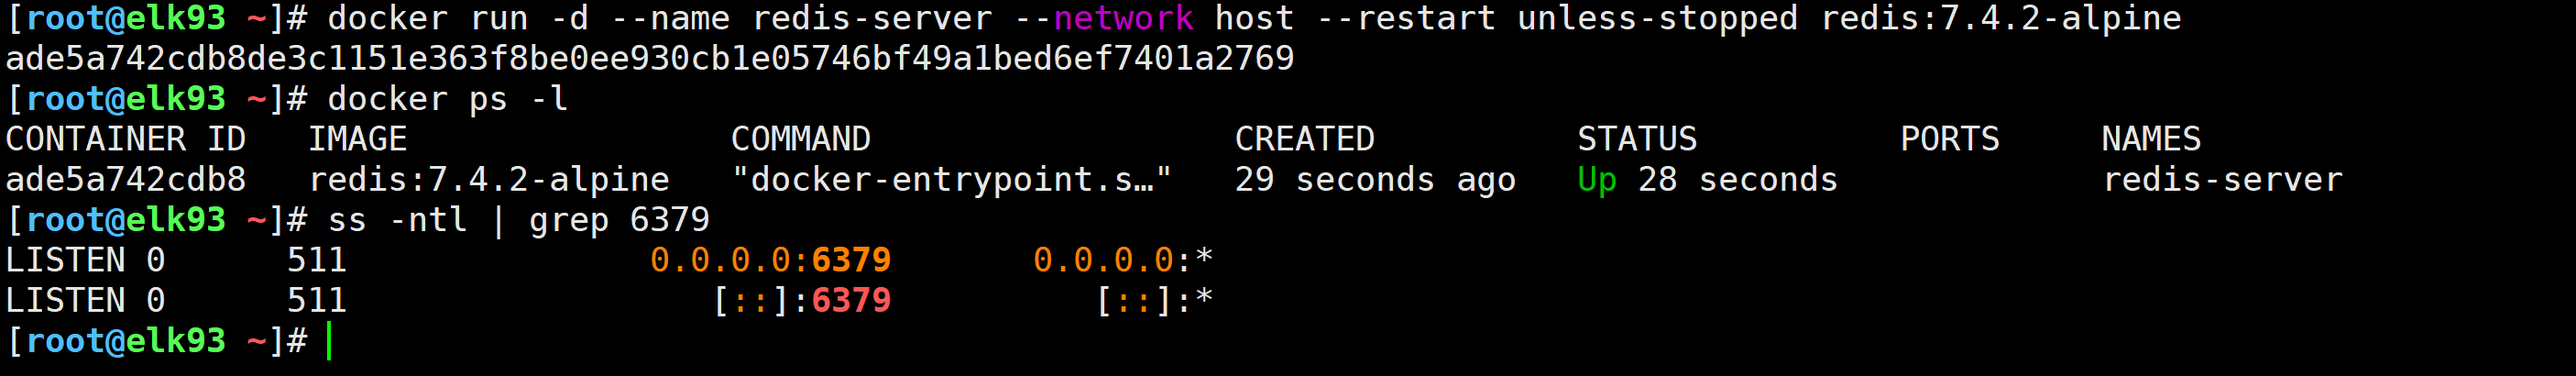
[root@elk93 ~]# docker run -d --name redis-server --network host --restart unless-stopped redis:7.4.2-alpine
[root@elk93 ~]# docker exec -it redis-server redis-cli -n 5 --raw
127.0.0.1:6379[5]> KEYS *

127.0.0.1:6379[5]> set haha xixi
OK
127.0.0.1:6379[5]> set haha 嘻嘻
OK
127.0.0.1:6379[5]> get haha
嘻嘻
127.0.0.1:6379[5]> set xixi 哈哈
OK
127.0.0.1:6379[5]> KEYS *
haha
xixi
127.0.0.1:6379[5]>
wget https://github.com/oliver006/redis_exporter/releases/download/v1.76.0/redis_exporter-v1.76.0.linux-amd64.tar.gz
tar xf redis_exporter-v1.76.0.linux-amd64.tar.gz -C /usr/local/bin/ redis_exporter-v1.76.0.linux-amd64/redis_exporter --strip-components=1

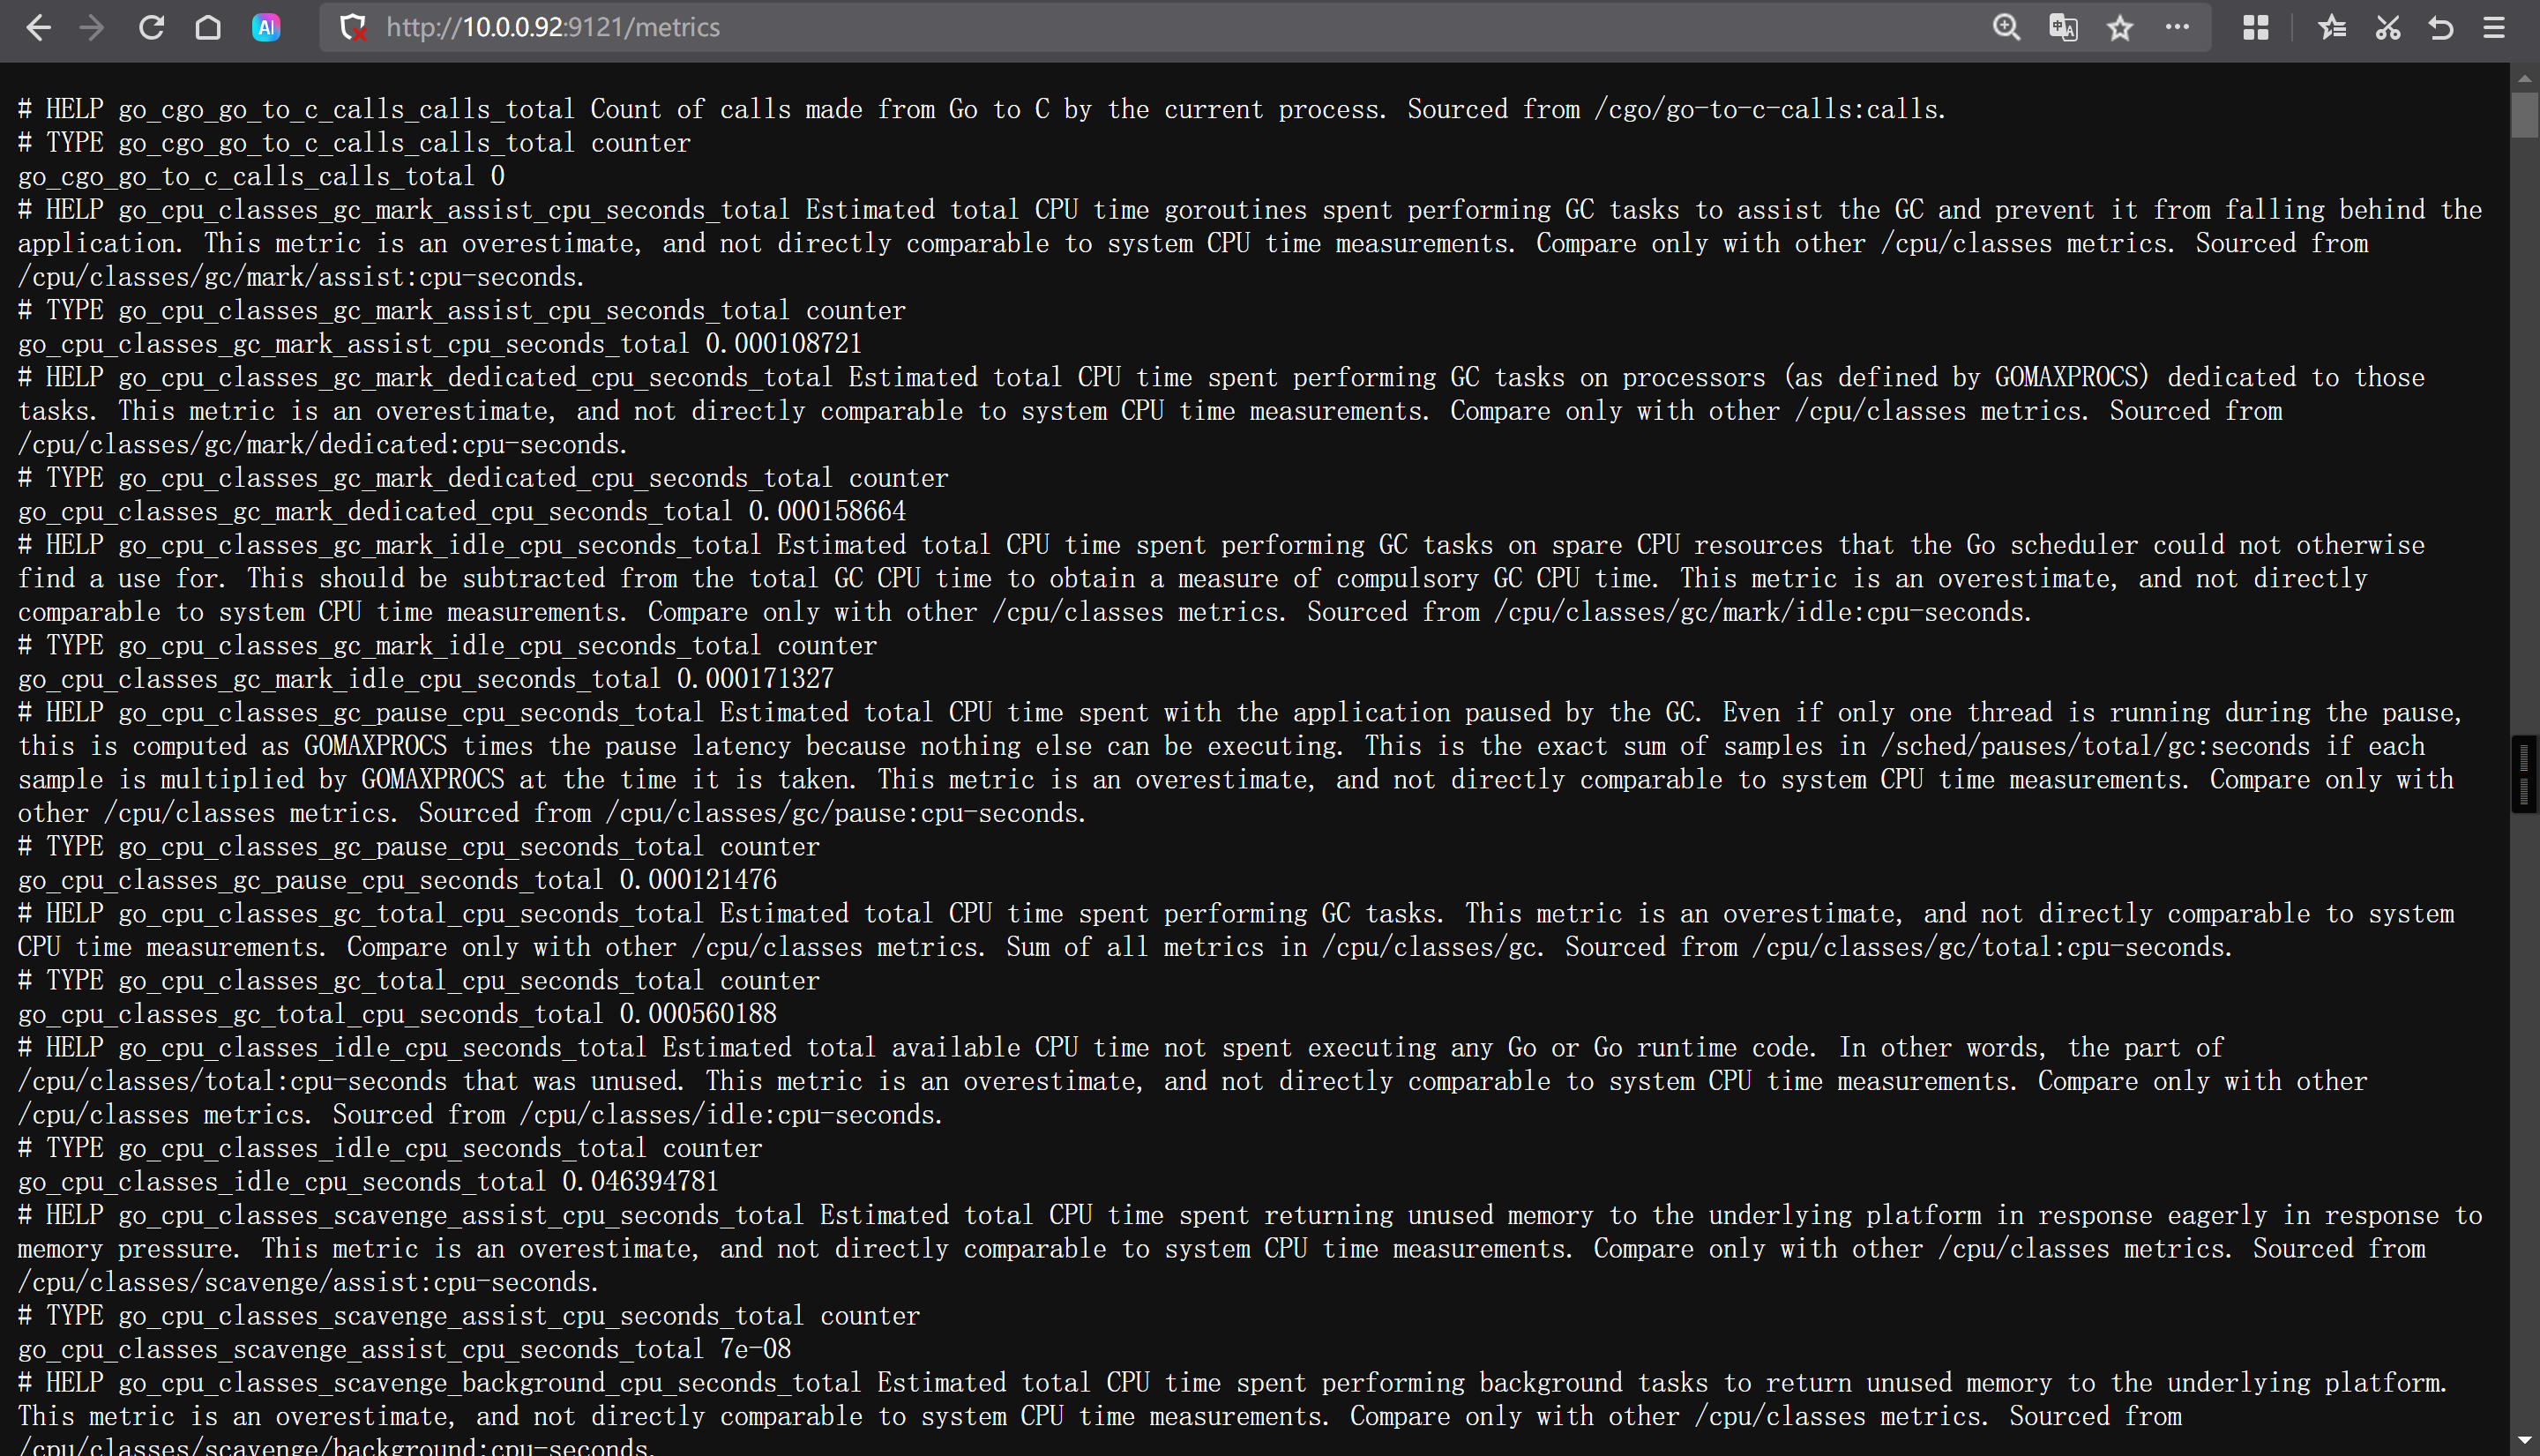
[root@elk92 ~]# redis_exporter -redis.addr redis://10.0.0.93:6379 -web.telemetry-path /metrics -web.listen-address :9121
http://10.0.0.92:9121/metrics
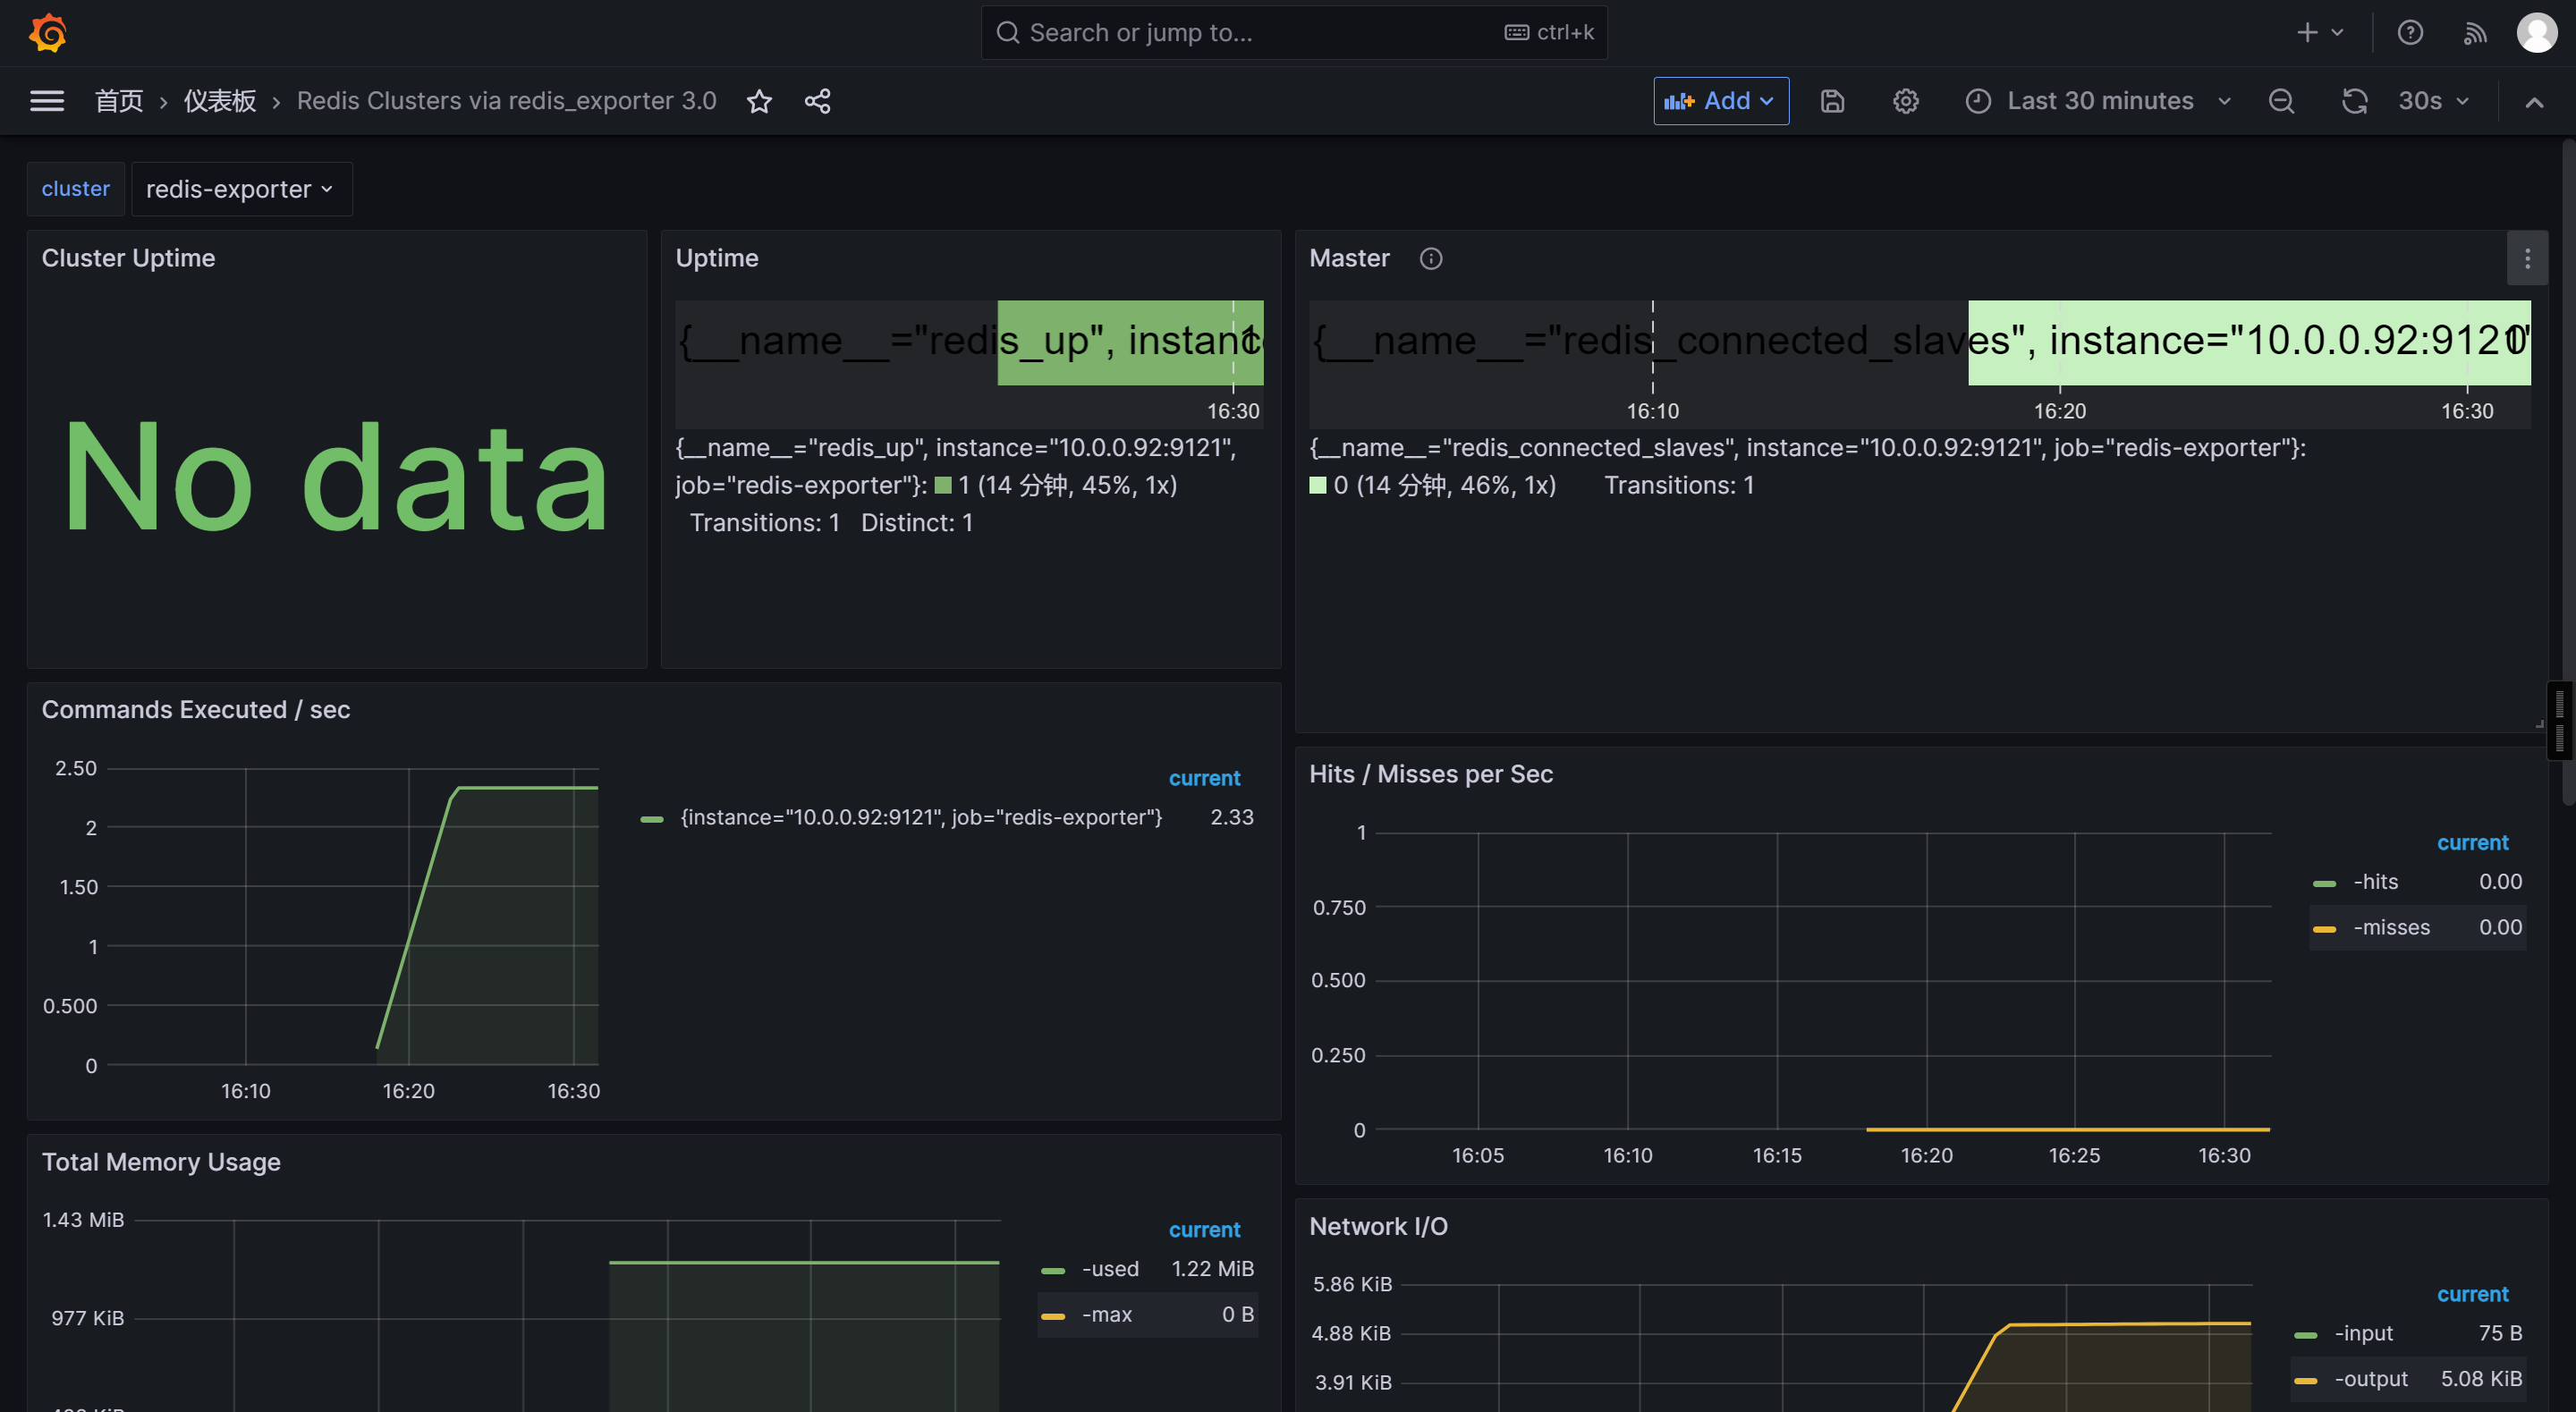
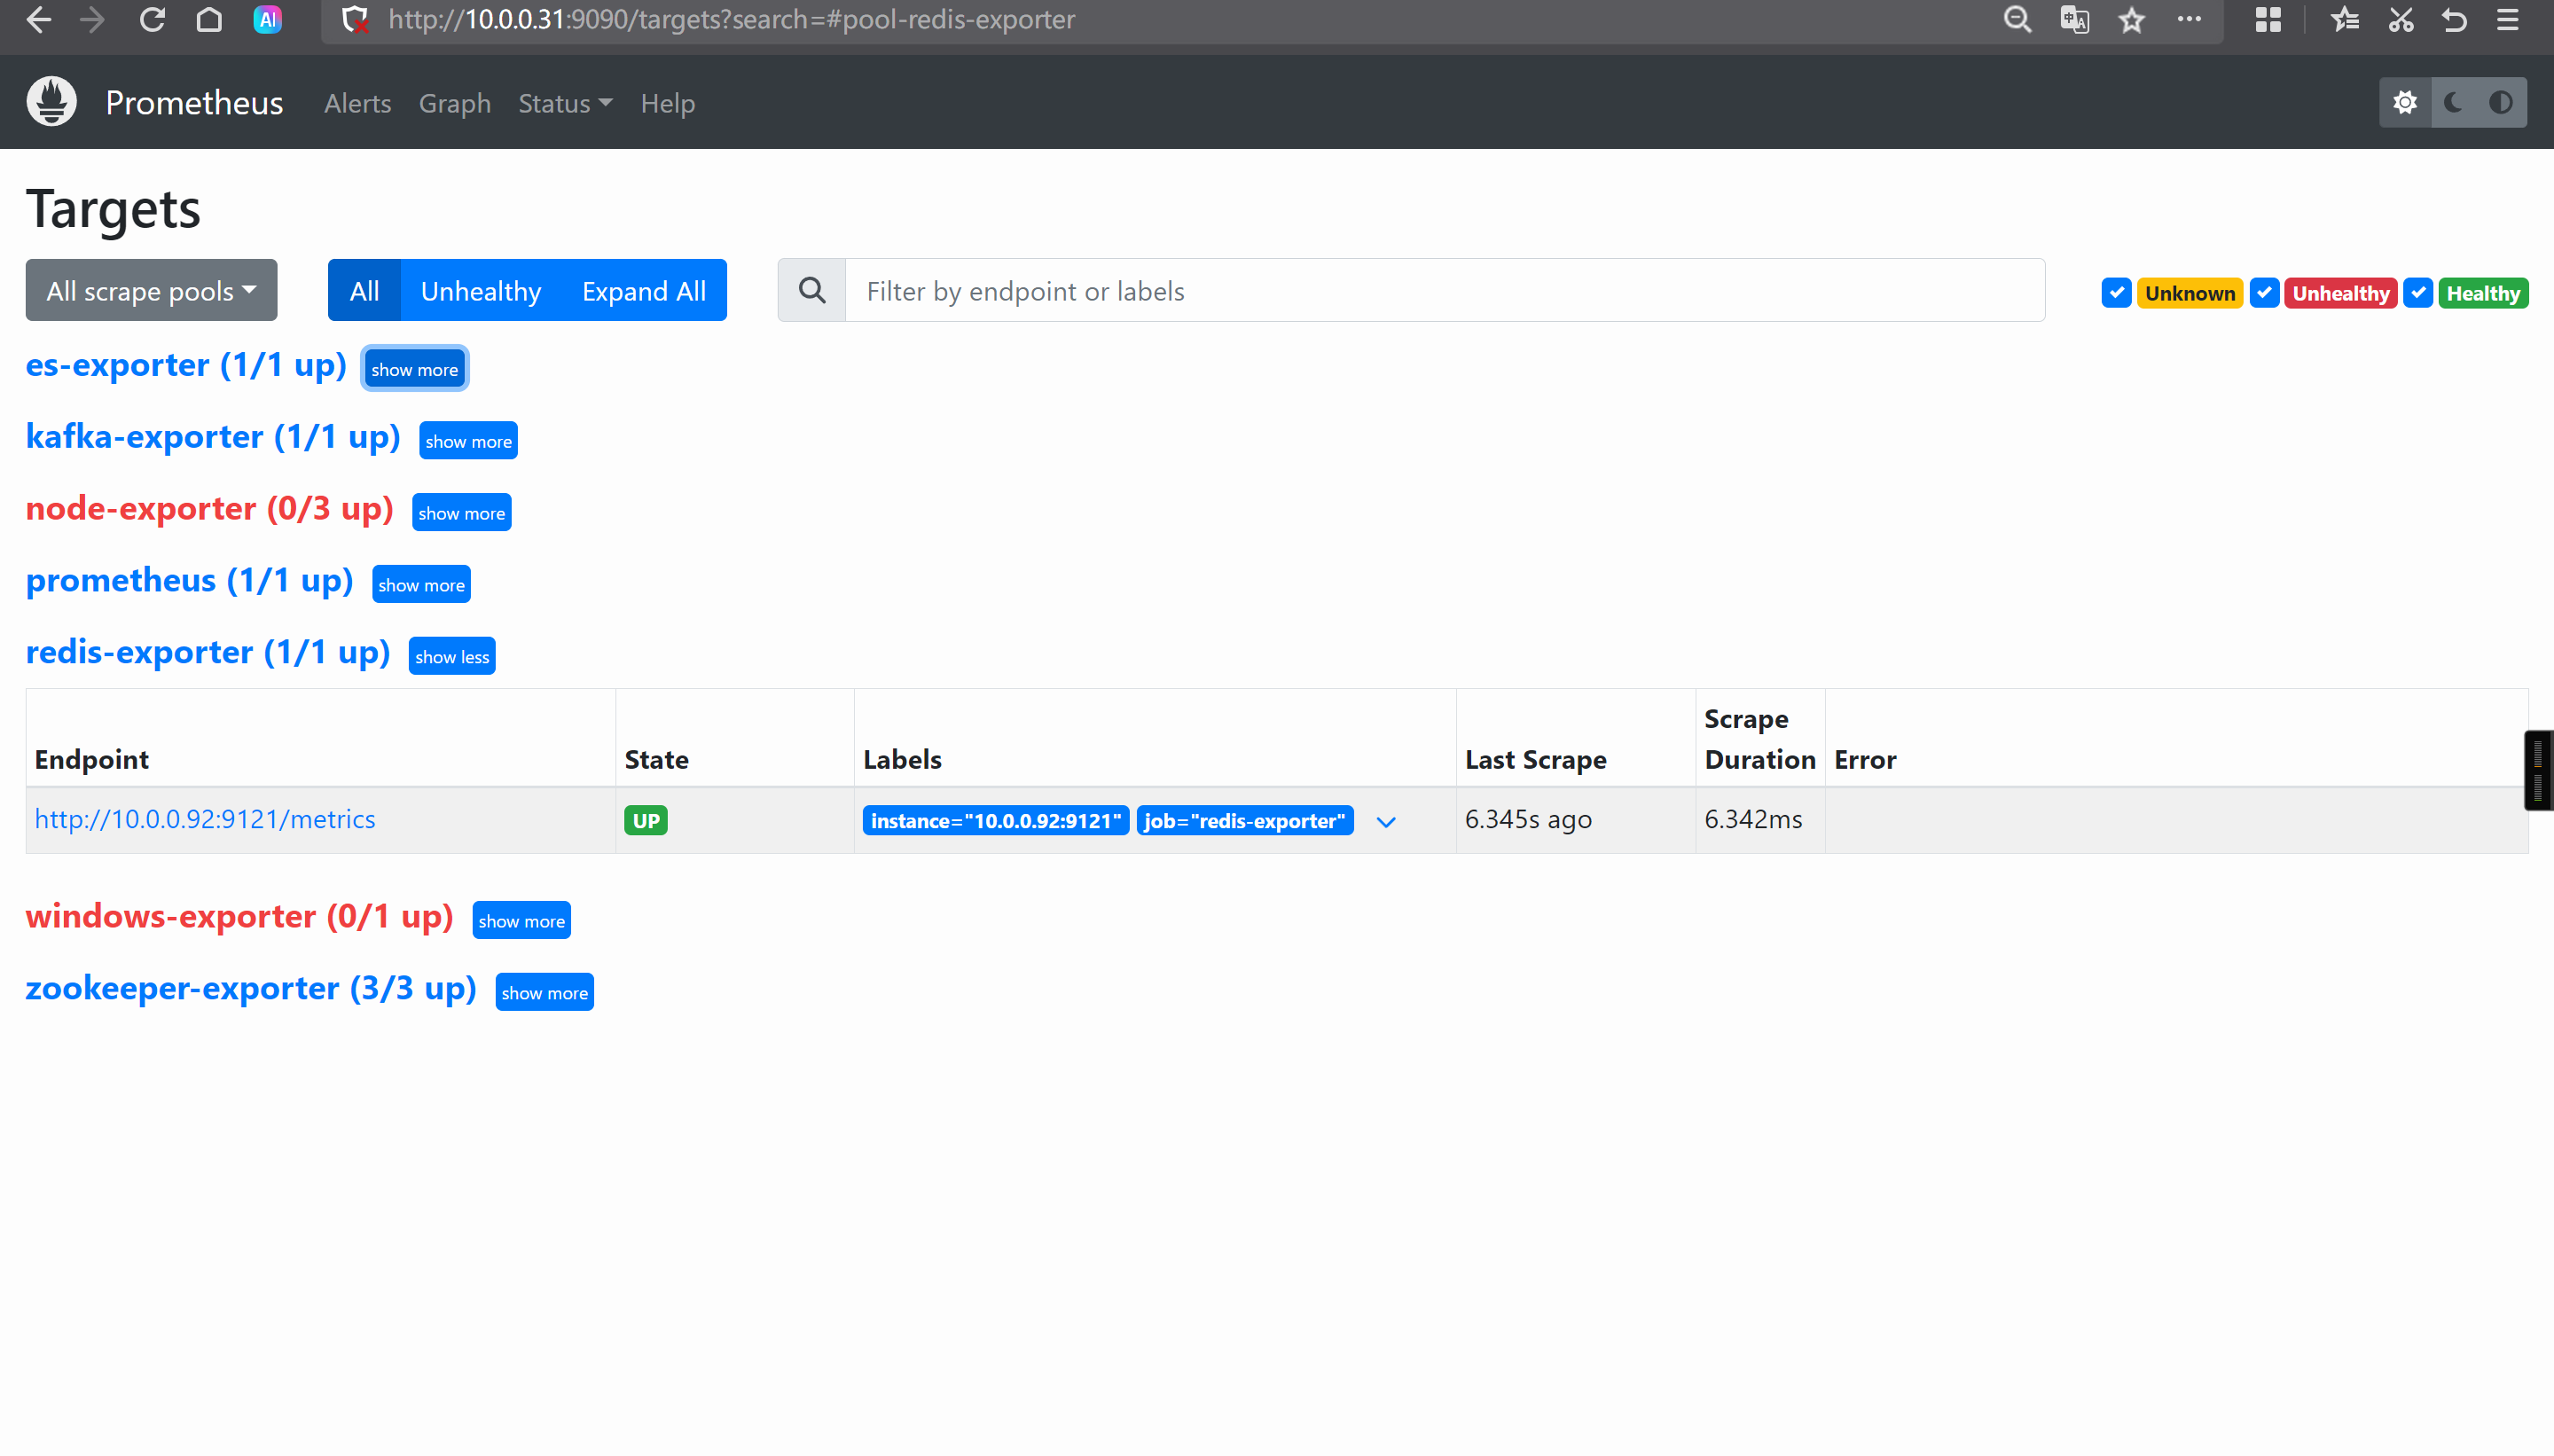
[root@prometheus-server31 ~]# vim /app/tools/prometheus-2.53.4.linux-amd64/prometheus.yml
  - job_name: "redis-exporter"
    static_configs:
      - targets:
          - 10.0.0.92:9121
[root@prometheus-server31 ~]# curl -X POST 10.0.0.31:9090/-/reload
http://10.0.0.31:9090/targets?search=
11835
14091
14615  # 缺少插件。
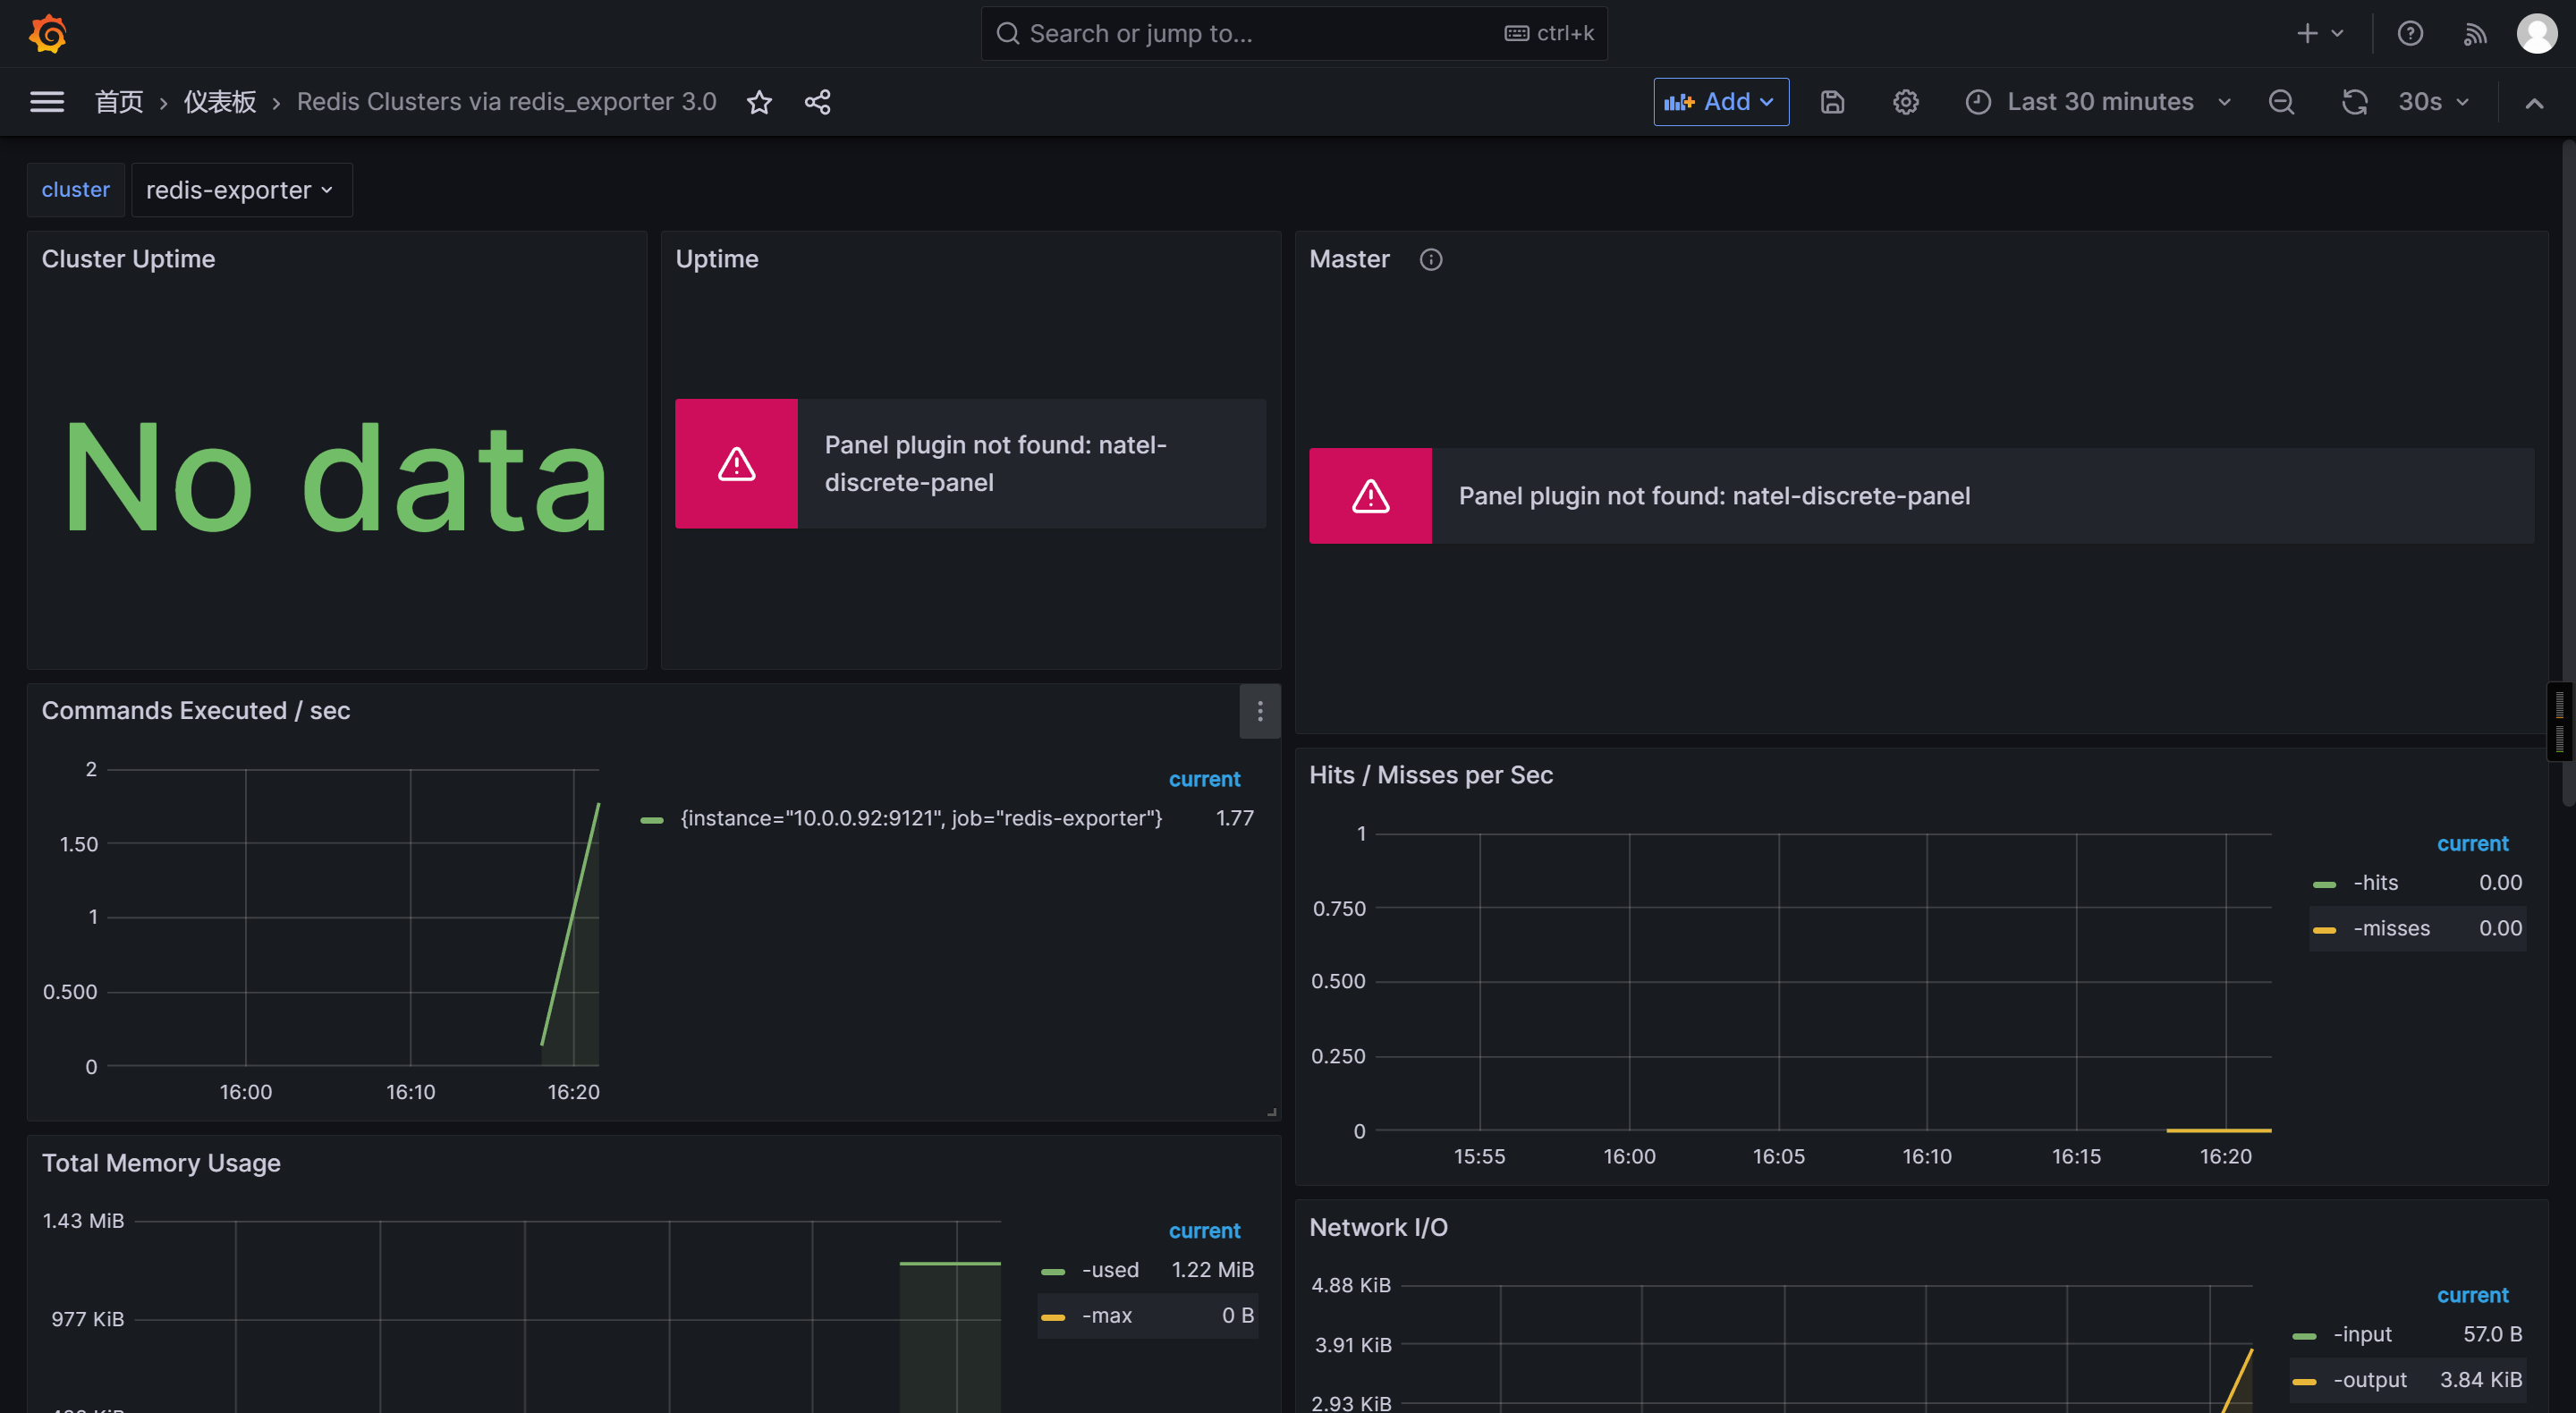
Grafana支持安装第三方插件
例如,报错如下: 说明缺少插件
Panel plugin not found: natel-discrete-panel
[root@prometheus-server31 ~]# ll /var/lib/grafana/
total 3216
drwxr-xr-x  5 grafana grafana    4096 Sep  5 08:21 ./
drwxr-xr-x 42 root    root       4096 Sep  5 03:33 ../
drwxr-x---  3 grafana grafana    4096 Sep  5 03:33 alerting/
drwx------  2 grafana grafana    4096 Sep  5 03:33 csv/
-rw-r-----  1 grafana grafana 3268608 Sep  5 08:21 grafana.db
drwx------  2 grafana grafana    4096 Sep  5 03:33 png/
[root@prometheus-server31 ~]#
[root@prometheus-server31 ~]# grafana-cli plugins ls
Error: ✗ stat /var/lib/grafana/plugins: no such file or directory
[root@prometheus-server31 ~]#

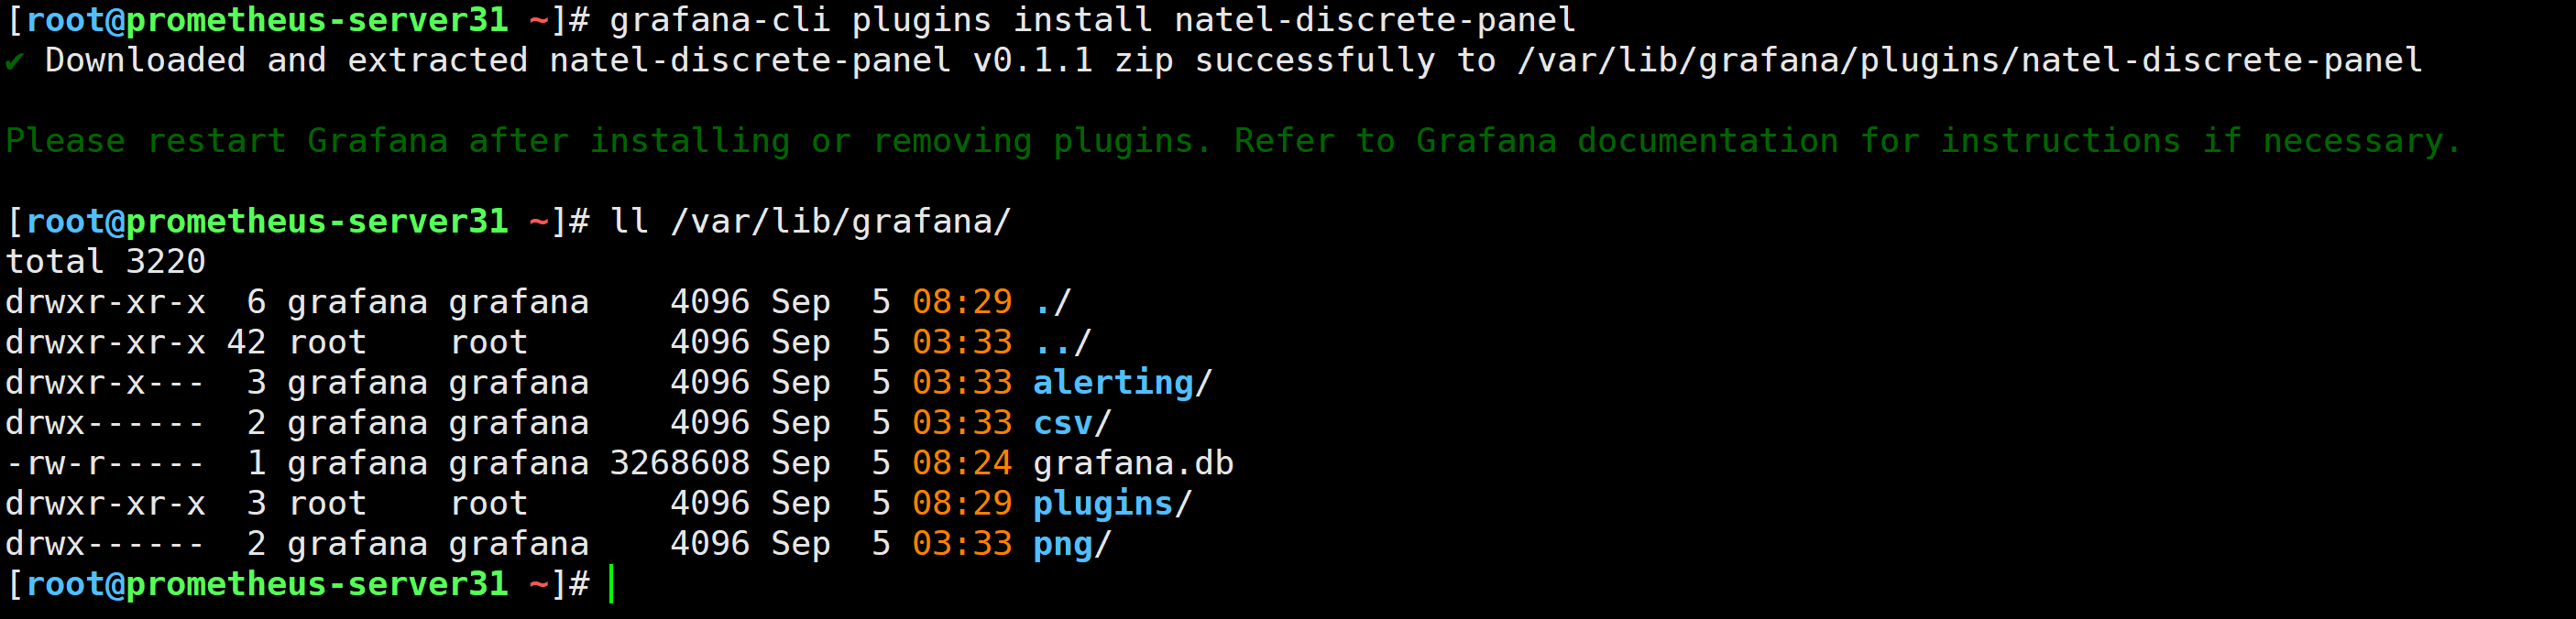
[root@prometheus-server31 ~]# grafana-cli plugins install natel-discrete-panel
✔ Downloaded and extracted natel-discrete-panel v0.1.1 zip successfully to /var/lib/grafana/plugins/natel-discrete-panel

Please restart Grafana after installing or removing plugins. Refer to Grafana documentation for instructions if necessary.

[root@prometheus-server31 ~]#
[root@prometheus-server31 ~]# systemctl restart grafana-server.service